Smart Home Annual Maintenance Cost Calculator
Estimate yearly smart home upkeep from your own maintenance amounts, device counts, battery and filter intervals, firmware admin time, cleaning cycles, and service reserve percentage.
Calculation breakdown
Battery-heavy
Best for door locks, contact sensors, water sensors, remotes, and battery cameras. Short intervals can dominate the yearly total.
Consumable-heavy
Best for purifiers, robot vacuums, robot mops, pet feeders, and filtration gear. Use the real replacement interval from your logs.
Admin-heavy
Best for local hubs, many automations, backups, firmware reviews, and permission audits. Time value is entered separately.
Reserve-heavy
Best when devices are aging or mixed across brands. Reserve covers unplanned upkeep without changing the base intervals.
| Maintenance component | Calculator formula | What to enter | Output affected |
|---|---|---|---|
| Battery replacements | Battery devices x amount x 12 / interval months | Your average amount for one device battery event | Annualized total and event count |
| Filters and consumables | Consumable devices x amount x 12 / interval months | Your average amount for one device consumable event | Annualized total and upkeep category mix |
| Firmware and admin time | Quarterly hours x 4 x hourly value | Your internal time value for updates and reviews | Annualized total and admin load |
| Cleaning cycles | Cleaning cycles per year x amount per cycle | Your supply or service amount for each cleaning cycle | Annualized total and maintenance events |
| Service reserve | Base yearly subtotal x reserve percent | A buffer percentage for unplanned maintenance | Final total and quarterly equivalent |
| Device group | Common maintenance driver | Interval input to check | Calculator handling |
|---|---|---|---|
| Door locks and sensors | Battery replacement | Months between battery swaps | Included in battery devices |
| Cameras and doorbells | Batteries, cleaning, and admin checks | Battery interval and cleaning cycles | Split across battery, cleaning, and admin |
| Air quality devices | Filters or cartridges | Consumable interval months | Included in consumable devices |
| Robot vacuums and mops | Brushes, pads, filters, solution, and cleaning | Consumable interval and cleaning cycles | Usually consumable plus cleaning |
| Hubs and network gear | Firmware, backups, logs, and permission checks | Admin hours per quarter | Included in admin time value |
| Annual load band | Signal | Best review action | Watch item |
|---|---|---|---|
| Low per-device load | Most devices need little annual upkeep | Confirm inactive devices are not counted | Hidden admin time |
| Moderate per-device load | Several categories contribute to the total | Review the highest subtotal category first | Short consumable intervals |
| High per-device load | Upkeep may be concentrated in a few devices | Separate battery and consumable device counts | Aging devices and reserve |
| Admin-heavy load | Time value is larger than material upkeep | Audit automations, backups, and firmware cadence | Repeated manual checks |
| Scenario size | Device count range | Typical upkeep mix | Useful calculator focus |
|---|---|---|---|
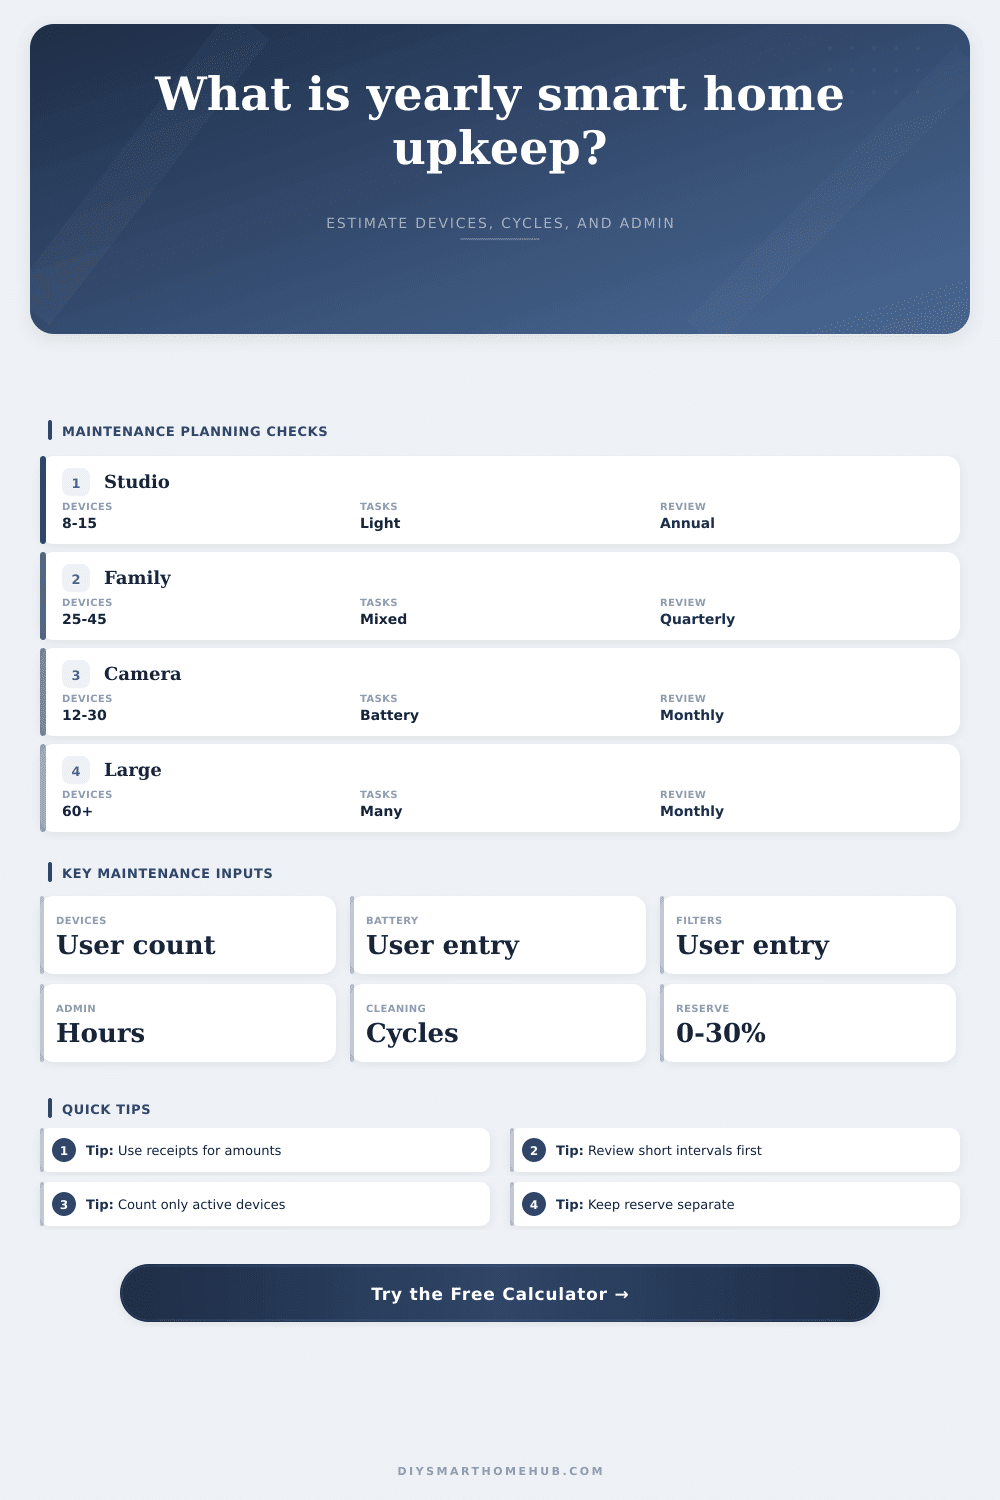
| Starter apartment | 8 to 15 devices | Locks, sensors, lights, and a hub | Battery interval and per-device load |
| Family house | 25 to 45 devices | Sensors, cameras, purifiers, and cleaning cycles | Category subtotal comparison |
| Whole-home automation | 45 to 75 devices | Many sensors plus admin and reserve | Quarterly equivalent and reserve effect |
| Multi-zone property | 75 or more devices | Cameras, network gear, filters, and scheduled upkeep | Event count and admin time load |
On Instagram, the smart home look seamless. Security camera watch over the perimeter without a hitch. Lights dim automaticly; coffee starts brewing before you wake up.
The truth is? You’re lucky if your smart home even feel like it’s working propery. It need maintenance. Door locks’ batteries runs dry. Air purifier filter clog. Firmware gets updated at night when you want to fall asleep.
The Real Cost of Keeping Your Smart Home Working
The majority of us buy it, then forget about it until it stop working. That’s the catch the majority of folks miss. The initial cost is just a entrance fee. The true cost is maintaining it all seamlessy… month after month.
Why care about maintenance? Because those little costs adds up fast. A few bucks here, a few there, and before you know it, those small expenses compound quick across your devices. Plus, it’s easy to overlook the cost of replacing one tiny AA battery. It also take effort to do that four times a year on 20 device. Plugging in your device totals and replacement intervals into the calculator above save you from guessing at your automations’ true time/money drain. It do the math for you.
So let’s do some math: How many pieces of actualy working hardware do you have? Speakers, cameras, smart locks, hubs, sensors… what can talk to something else? Don’t include stuff sitting on a shelf or under a chair you forgot was there for six months. Stuff that doesn’t work don’t require upkeep.
When it comes to batteries, consider how frequently you replace them. Two years here, six months there. Use the shortest amount of time that things stays stable. If one speaker need batteries every four months while others last a year, the shorter interval will dominate your annual total. Four would of be how much you spend per year.
Similarly, consumables also applies (i.e., not just power cells but physical parts). These include filters for air purifier. These include mop pads and brush rolls for robot vacuum. Cleaning cycle are used for pet feeders. Consider how often you replace them and how much it cost to do so. Input the real price from your receipt. Not the list price on manufacturer website.
Subscription services and discounts has a massive impact on the real-world cost. Smart living have its invisible tax: Admin time. You spend hours on network checks, permission audits, and firmware updates. Two and a half hours per quarter if you manage your system that way. That is ten hour a year. How much do you value that? Give it an hourly value (your wage rate, for example). Or just make up a comfortabley number that represents your distaste for that job. You’ve now given wasted time a concrete cost.
There is another layer here: the cost of cleaning cycles. Regularly, there are thing to clean. Camera lenses, robot vacuum sensor. Add in the cost of supplies (or professional services!).
For the unexpected, there’s also a service reserve percentage. Things gets old. Batteries expands. Connections fail. A base subtotal with an extra 10-30% is a cushion for the unplanned fix. It avoids that sticker-shock moment when you realize you’re replacing something.
On the page are tables showing how these buckets fit together. For example, it show how admin-heavy homes require more brainpower and battery-heavy homes requires lots of attention. You’re not trying to avoid maintenance. You’re trying to anticipate it.
How much do you want to spend on maintaining one device this year? That’s how you know when a new gadget is going to be worth it, even if it’s only slightly helpful. Is a new smart lightbulb worth $5 in annual admin time and upkeep? Probably not. Mostly it’s about knowing what you’re realy tracking. You’re not just spending money; you’re spending attention.
Run the numbers and see what breaks down. Is it mostly about battery? Switch to longer-lasting cells or go wired for those sensors. Does it come down to admin time? Clean up your automations or downgrade to a local-only hub that doesn’t need as many cloud checks. The calculator won’t tell you whether those decisions is good or bad. It’ll just show you how much your digital life weigh behind the scenes.
The ease of smart homes? Complexity is delivered. Want to get control back? Know how much it cost in a year. Make a choice to be cost aware or convenient. To have a device pay its own way, or suck up yours.
The lights will continue to dim on their own. The coffee will keep brewing. Except now you’ll know at what price.