Smart Home Cost Per Square Foot Calculator
Normalize your own smart home project amount by home area, covered rooms, device groups, infrastructure share, recurring annual amount, per-device exposure, and coverage density.
1.Choose a Planning Preset
2.Enter Your Scope and Amounts
3.Your Cost Density Results
4.Live Metric Snapshot
5.Formula Domain Comparison
Home Area
$0.00Project amount divided by the entered floor area. This is the main per-square-foot normalization.
Covered Rooms
$0Project amount divided by rooms or zones, useful when two homes have very different layouts.
Device Groups
$0Project amount divided by lighting, sensor, security, network, hub, and media devices combined.
Annual Recurring
$0.00Recurring annual amount divided by area, then combined with first-year amount when needed.
6.Coverage Density Reference
| Density band | Devices per 1000 sq ft | Typical scope pattern | Calculator interpretation |
|---|---|---|---|
| Lean | Under 18 | Core access, a few lights, limited sensors | Per-square-foot values can look low because coverage is selective. |
| Balanced | 18 to 34 | Room-by-room lighting, common sensors, a few hubs | Good for comparing similarly covered apartments and houses. |
| Dense | 35 to 54 | Many automations, security layers, climate or media zones | Device count explains more of the total than floor area alone. |
| Layered | 55 or more | Whole-home sensors, cameras, controls, hubs, and backups | Review device-group mix and infrastructure share together. |
7.Device Group Normalization Table
| Device group | Examples to count | Normalization role | What a high share can mean |
|---|---|---|---|
| Lighting and control | Switches, dimmers, bulbs, plugs, relays | Often scales with rooms and circuits | Per-room amount may be more useful than per-device amount. |
| Sensor and security | Contact, motion, leak, camera, lock, alarm | Often scales with openings and risk zones | Density can rise even when square footage is unchanged. |
| Network, hub, media | Hubs, bridges, access points, speakers, panels | Often behaves like shared infrastructure | Infrastructure share may dominate smaller homes. |
| All groups combined | Every counted endpoint and shared device | Builds the per-device denominator | Useful when comparing different home sizes with similar scope. |
8.Infrastructure Share Table
| Infrastructure share | Planning signal | Common included items | How to read the output |
|---|---|---|---|
| 0% to 15% | Device-led | Mostly endpoints with little shared backbone | Per-device values often describe the plan well. |
| 16% to 30% | Balanced backbone | Hubs, bridges, mounts, controllers, setup | Compare device subtotal and infrastructure subtotal together. |
| 31% to 50% | Infrastructure-heavy | Networking, panels, racks, gateways, labor | Per-square-foot values may reflect backbone work more than endpoints. |
| Over 50% | Backbone dominant | Major network, wiring, controller, or retrofit share | Review whether the project should be split into phases. |
9.Common Scope Examples
| Scope example | Area pattern | Room pattern | Best denominator |
|---|---|---|---|
| Starter room | Small area | One or two spaces | Per room and per device |
| Apartment plan | Compact whole home | Several covered zones | Per square foot and density |
| Whole-house phase | Broad coverage | Many room types | Per square foot, room, and group |
| Backbone refresh | Any size | Infrastructure-led | Infrastructure share and annual amount |
10.Calculator Tips
We all start our smart home journey with a single gadget that we love, like a smart lock. It could be a voice assistant. We then find ourselves asking “why is this so much more expensive?” This isn’t because the devices you want to buy are overpriced. In fact, the devices often aren’t even the problem.
Most homeowners don’t factor in the necessary setup required to connect dots between their devices. They also fail to consider that a physical environment affects the real-world price of getting things covered. How many device do you think you need? The costs could look the same for a small apartment different than a big house. Without a common way to compare them, it can feel like a big house cost the same as a small one if they both have five devices. That’s very different work and scope.
How to Calculate the True Cost of Smart Homes
At that point, breaking down the expense in terms of square footage make sense. It’s not home value metric. But it’s a sanity check for what your home automation plan will cost. This is where the calculator does its best work: it helps you cut through the noise to find the signal, because it forces you to think about what you’re really getting.
There’s a field for the number of devices in each group; there’s a field for the number of rooms being covered; there’s even a field for the overall project amount. And this is where it gets interesting. How do these figures relates? If I plug my total spend into the calculator, I’m not only accounting for hardware costs. I’m also accounting for the price of the central hub. I am including the labor to install everything and the yearly fees for cloud storage or monitoring.
A lot of folks gloss over the subscription part until they recieve the first charge on their credit card; three months after purchase! Turn that figure into an annual cost and divide it by the square footage of your home, and now you have a better idea of long-term impact. A sticker shock becomes a more acceptable monthly reality.
The infrastructure share percentage is one of the more difficult-to-understand inputs. This is the percentage of your budget allocated to wiring, bridges, hubs, access points, etc. It does not include sensors or bulbs, which are endpoints. The infrastructure share percentage will be greater in older homes with poor Wi-Fi dead zones, which is totally fine. If you already have a network and can use that as a backbone then your infrastructure share will be lower and that’s cool too. Whole home systems tends to require dedicated Zigbee bridges or mesh nodes to really work well, so those would push up your share. Anything above thirty percent on infrastructure share is typically an indicator that you’re getting reliability (not merely functionality) for that money, and that’s something most folks should of be OK with, as long as they know that’s the trade-off.
Secondly, there’s the density of your coverage. By that I mean how many devices is covered per thousand square feet? Your first room starter kit may be expensive per device, but not so much per square foot. Likewise a sparsely covered large house might be cheap per device but expensive per square foot. But one tells you you’re getting a lot of bang for your buck and one tells you you’re paying a lot of money for something that can’t actualy do all that much.
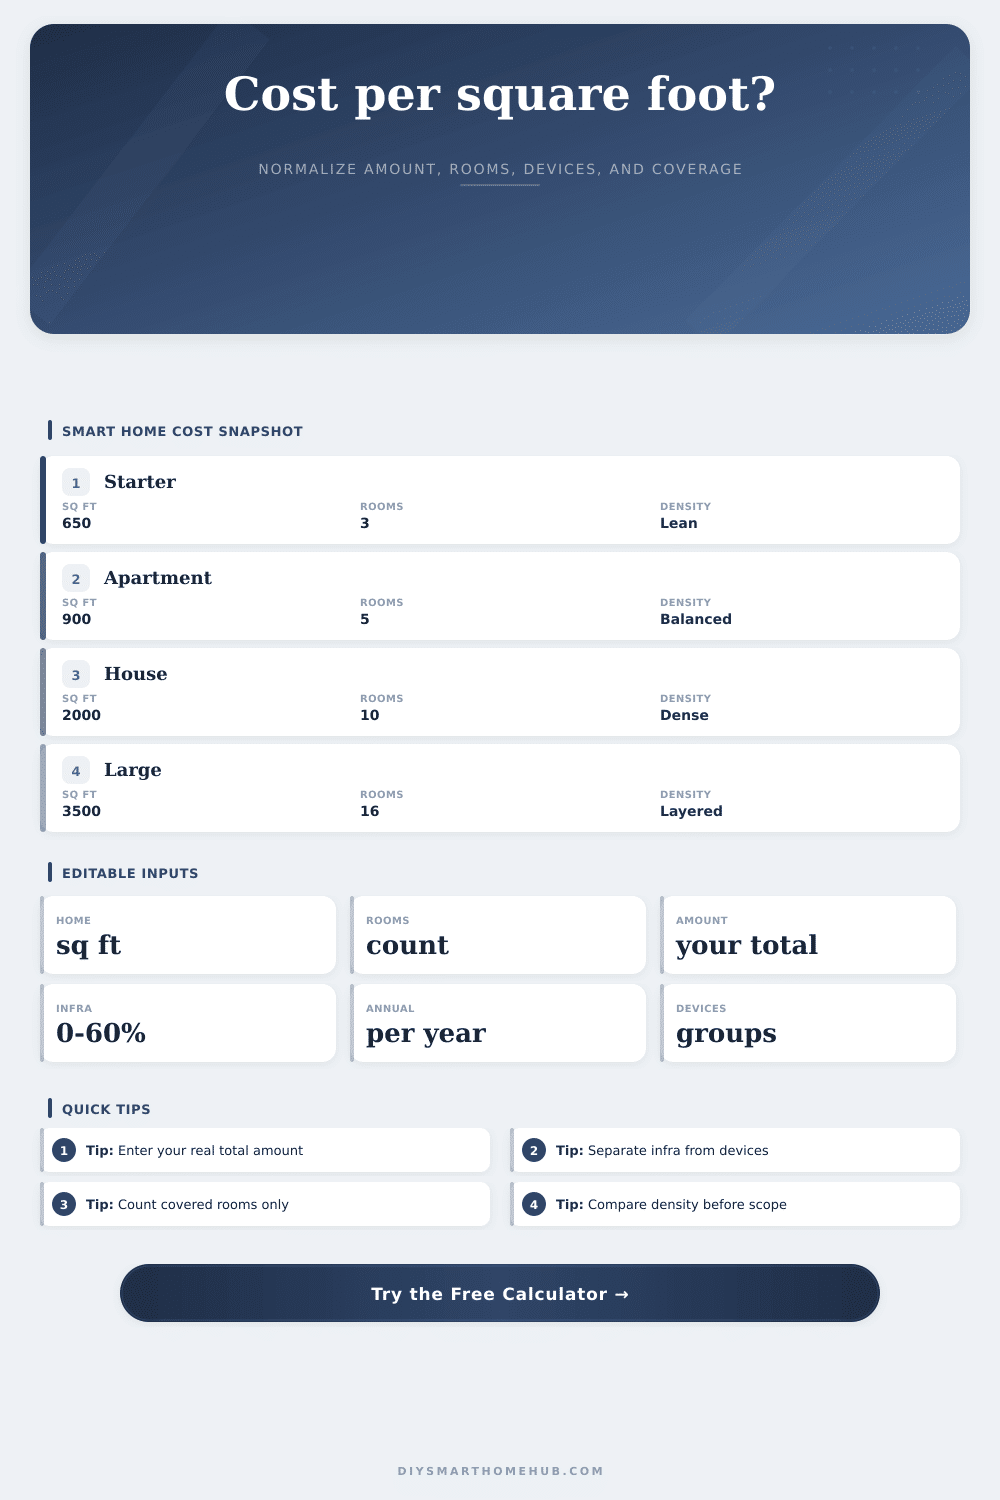
On the page, I lay this out using a table that sorts setups into four categories: Lean, Balanced, Dense, Layered. If you end up in the latter category (layered), then odds are you’re paying for more complex automation scenes and/or redundancy versus just straight up basic control. There’s a cost to that complexity and it come through in the math.
And then finally examine the output. Don’t judge it. Spending more per square foot isn’t necessarily overspending: perhaps you built in an advanced media system for entertaining, or a dense sensor network for security. In other words, don’t think about reaching an arbitrary dollar amount; instead ask yourself whether you paid for convenience or coverage, endpoints or the backbone. When you do this you’ll realize that the spreadsheet is no longer something that makes you anxious, it’s a way to plan.
And knowing what you’re getting is worth far more than shaving a few bucks off a hub.