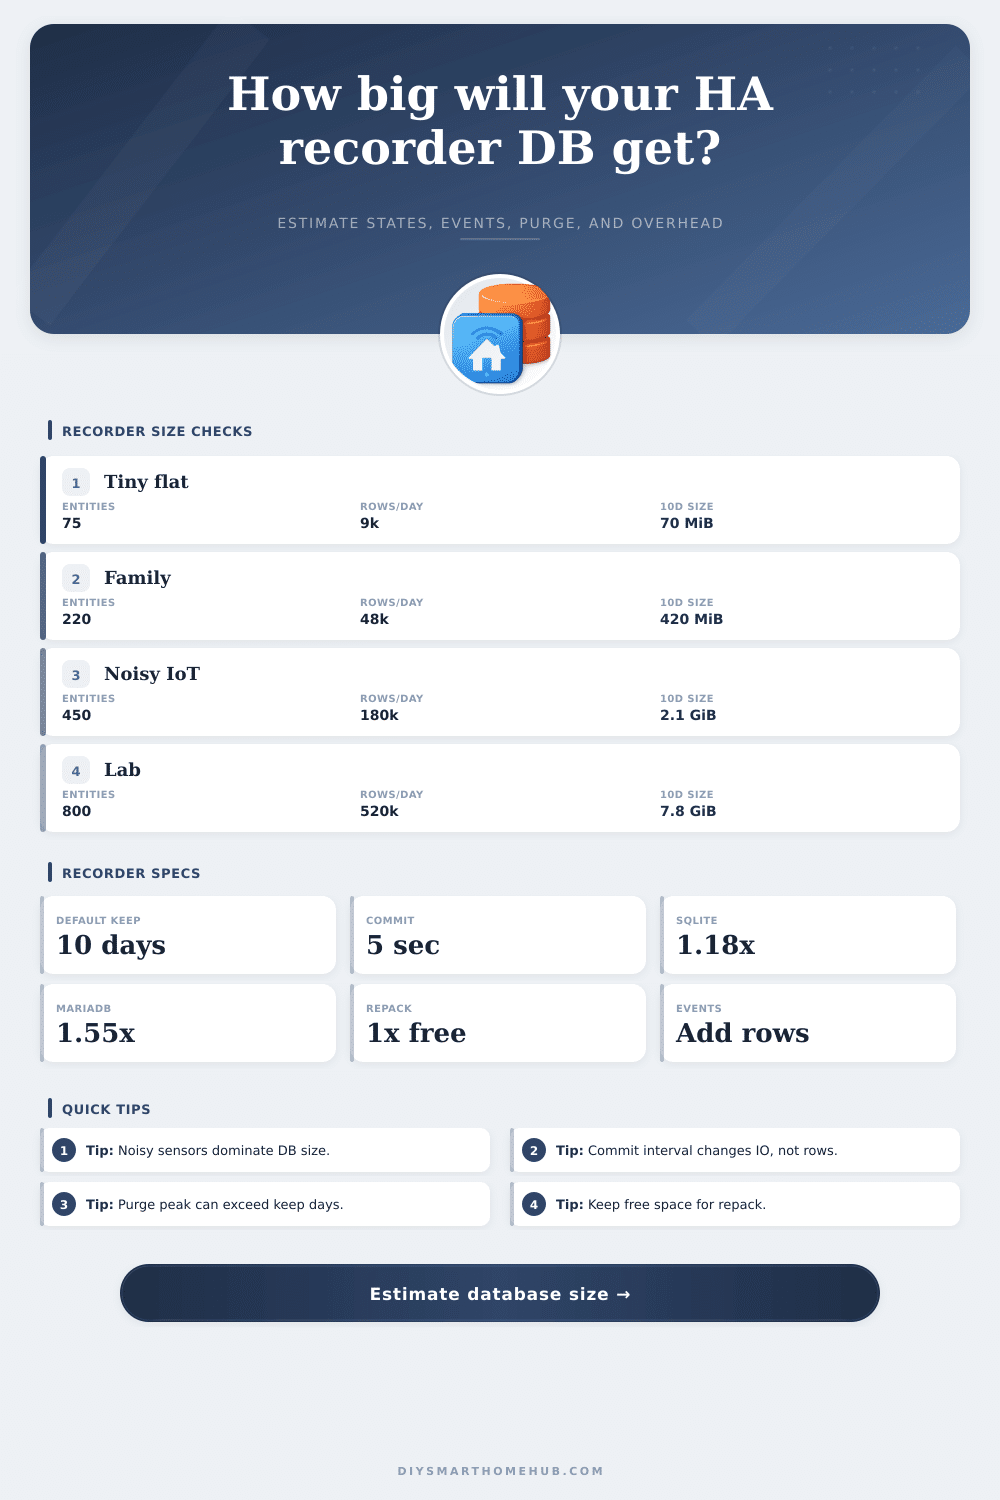
Home Assistant Recorder Database Size Calculator
Estimate recorder database growth from entity count, state changes per day, row size, retention, events, purge cadence, commit interval, database engine overhead, and reserve space for repack or rebuild operations.
💾Recorder presetsPick a Home Assistant profile, then adjust the assumptions.
⚙Calculator inputsRows first, then retention and engine overhead.
📊Live recorder assumptionsThese values update from the selected engine and inputs.
Recorder size results
🧮Recorder reference tablesUse these ranges when you do not have measured DB stats yet.
| State row assumption | Bytes/row | Best fit | Size signal |
|---|---|---|---|
| Lean binary sensors | 180-280 | Doors, motion, switches | Small rows and low attributes |
| Typical smart home | 320-520 | Mixed sensors and lights | Good default planning range |
| Energy and weather | 500-850 | Verbose sensors | Attributes can dominate |
| Very noisy entities | 850+ | Rapid updates or large JSON | Measure with recorder statistics |
| Events overhead | Typical events/day | Bytes/event | Planning note |
|---|---|---|---|
| Quiet install | 1k-5k | 180-280 | Few automations and custom events |
| Normal home | 5k-20k | 250-420 | Logbook and automation activity |
| Camera or alarm heavy | 20k-80k | 300-600 | Frequent motion and event triggers |
| Event storm | 80k+ | Varies | Find and filter the source |
| Database engine | Overhead used | Free-space target | Assumption |
|---|---|---|---|
| SQLite default | 18% | 2.5x | Default and recommended HA engine |
| SQLite busy history | 35% | 2.5x | More page churn and fragmentation |
| MariaDB / MySQL | 55% | 2.0x | InnoDB indexes and row overhead |
| PostgreSQL | 45% | 2.0x | External server with indexes |
| Home profile | Entities | Changes/day | Recorder pressure |
|---|---|---|---|
| Apartment | 50-120 | 5k-20k | Usually under 250 MiB at 10 days |
| Family house | 150-350 | 25k-90k | Often 300 MiB to 1.5 GiB |
| Energy-heavy | 250-500 | 100k-350k | Noisy sensors drive growth |
| Large lab | 600+ | 400k+ | Use filters and measured stats |
🔍Database comparison gridSame raw rows, different storage behavior.
💡Recorder sizing tips
This calculator is an estimator for Home Assistant recorder planning. Real size depends on schema version, attribute payloads, entity behavior, database page size, indexes, vacuum/repack timing, and the selected SQL backend.
Home Assistant is supposed to make your home work for you. When you don’t have to lift a finger as the lights dim and your thermostat cranks down, it’s magicaly. Unfortunately, there’s an unseen price tag on all that magic.
Your motion sensor detects motion, temperatures ticks up or down, and states change. Each of these events is recorded into a database file on your drive. Until your system begins to lag or until you notice that your SD card is full, most folks don’t think about it. Yes, the recorder is meant to record history… but how do you tell it when you’ve had enough? It just keeps recording.
How to Save Space on Your Home Assistant Drive
After you estimate your entities and average daily state changes, the calculator above will crunch numbers for you. It removes all of the guesswork from calculating how quickly your disk space dissapears. You do not need a database administrator‘s degree here, just an understanding of what causes that growth in the first place.
In most cases, the number of devices is far down the list as factors in this growth. More often, it’s simply how frequently those devices updates us on their status. A light switch toggled twice a day generates a hundred times less data then a motion sensor firing off every thirty seconds. Most folks get caught up on that imbalance. Ten sensors sounds like ten units of work. Not so much.
By default, Home Assistant retains ten days worth of data. Ten days seems like a fair amount; you can go back and see what happened on Saturday morning when the front door was opened, or what the energy consumption was like on last Tuesday. But remember: Databases aren’t just boxes with a bunch of bits in them. When the system deletes your old data, it doesn’t erase the bits right away. It marks those pages as empty. And over time, these pages gets fragmented. The file expands past the actual data stored inside. This is why there is a free-space multiplier built-in to the tool. You want some space to accommodate the database engine rearranging its data without choking on a full disk.
This is by far the most common cause of unexpected recorder failure… People simply ignore the overhead.
That’s all well and good if you swap out your SQLite for PostgreSQL or MariaDB, which would be an upgrade. But that alters the math quite substantialy. An external database comes with its own set of index structures and storage engines. These is not optimized for storing simple linear log data, but instead for supporting complex queries and concurrent access. That means it carries additional overhead per row. To account for that, the calculator applies various multipliers based on what engine you choose. Using a local SQLite database offers you simplicity. Switching to MariaDB gives you robustness at the expense of complexity and storage efficiency. And there’s no such thing as a free lunch when it comes to infrastructure.
The third hidden variable is events. Event rows are generated by automation triggers, logbook entries, and custom integrations. These event rows can be smaller than state changes, or they can be larger with verbose JSON attributes depending on how they’re set up. They also add up fast if your home is noisy (e.g., lots of devices waking up periodically to report battery level), which could include your Zigbee network.
Binary sensors produce small, infrequent rows; this is why you might assume excluding them from the recorder will save some space. But it’s typically not that big of a difference. It is more important to filter out high-frequency numeric sensors that update multiple times per minute, yet you only really care about averages (like hourly). It also lets you see the effect of filters on your data. You put in an exclusion percentage and it will tell you what the projected size would be if your recorder config was pruned heavily. That’s a very powerful lever.
For most people they go with defaults and then add an integration and they wonder why disk usage has spiked. Typically the reason is some specific thing is clogging up the database with unneeded updates. The best thing to control growth is identifying the offenders and turning them down.
Think forward, not just today’s number, when planning for storage. Systems scale. More automations, more sensors, more cameras: your system will naturaly expand over time. Schema drift and natural growth can be accounted for with a 15% or more buffer in your math. That extra space is breathing room for forgetting to tune a new integration; it’ll happen.
The page includes some general benchmarks to use as anchors if you’re wondering where to start based off your home size, such as a small apartment. Large lab?). Don’t treat these as absolutes though; they’re rough reference tables.
At the end, this all boils down to balancing your use case against your storage needs. How much do you care about having history? Do you want enough history to impact performance (bad) or fill up your whole drive (also bad)? We’ve given you the numbers. It’s up to you to understand your use case and make an informed decision about what you do care about. Are you interested in every minute’s temperature over the past year? Nope. Did your alarm arm at midnight last night? Yes please. Trim off everything you don’t care about, and tune your system to hold on to what you do care about. Your disk space will thank you. And your smart home won’t bog down every time you check in because its drive is full.
You should of checked the storage earlier.