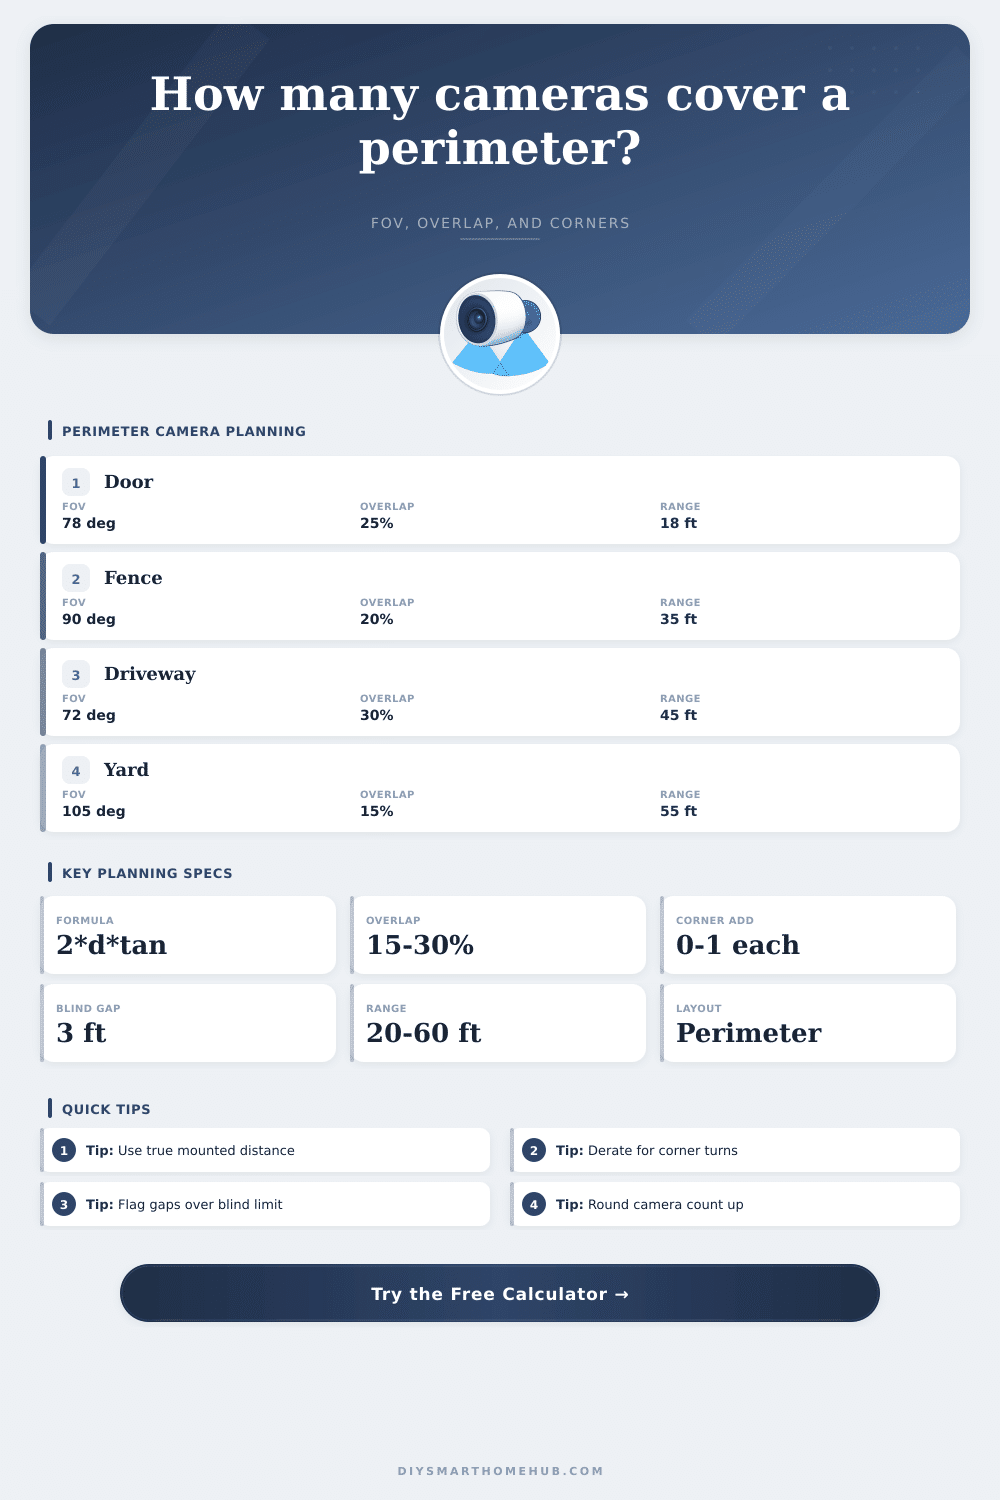
Camera Overlap Count for Perimeter Calculator
Estimate perimeter camera count from mounted distance, horizontal field of view, required overlap, blind-zone tolerance, corner turns, and extra corner coverage allowance.
🎯 Perimeter presets
⚙ Camera and perimeter inputs
Perimeter geometry and lens assumptions
Live formula assumptions
📐 Current setup spec cards
📊 Coverage reference tables
| Camera profile | Typical FOV | Best use | Planning note |
|---|---|---|---|
| Very wide lens | 115 to 130 deg | Short perimeter runs | Large width, less detail at distance. |
| Wide angle | 100 to 110 deg | Yards and patios | Good for broad coverage with modest range. |
| Standard lens | 84 to 95 deg | Fence and wall lines | Balanced width and identification detail. |
| Narrow lens | 65 to 78 deg | Driveways and gates | Needs more cameras for the same perimeter. |
| Long range lens | 45 to 60 deg | Remote approaches | Long reach but small coverage width. |
| Formula part | Calculator logic | Example | Meaning |
|---|---|---|---|
| Coverage width | 2 x distance x tan(FOV / 2) | 2 x 35 x tan 45 | 70 ft camera view width |
| Effective spacing | Width x (1 - overlap) | 70 x 0.75 | 52.5 ft counted per camera |
| Base cameras | Perimeter / effective spacing | 250 / 52.5 | Round up to cover the run |
| Overlap count | Camera count for adjacent pairs | Closed loop = count | Shared coverage zones |
| Corner top-up | Corners x extra factor | 4 x 0.25 | Added turn coverage allowance |
👁 Common perimeter examples
| Perimeter example | Typical perimeter | FOV and distance | Overlap approach |
|---|---|---|---|
| Front walk and porch edge | 100 to 160 ft | 90 deg at 18 to 25 ft | 20% to 30% for entry coverage. |
| Suburban backyard fence | 220 to 360 ft | 95 to 110 deg at 30 to 45 ft | 15% to 25% for general monitoring. |
| Driveway and side gate | 160 to 300 ft | 65 to 80 deg at 35 to 55 ft | 25% to 35% near vehicle paths. |
| Warehouse exterior wall loop | 600 to 1200 ft | 72 to 90 deg at 45 to 75 ft | Use corner top-ups for turns and dock bays. |
| Rural outbuilding perimeter | 300 to 800 ft | 50 to 70 deg at 60 to 120 ft | Count blind-zone gaps separately. |
💡 Calculation notes
It’s easy to get excited about planning out a security system, then end up with a headache over spreadsheets. Got a yard? Cameras in mind? That sounds good…unless you turn those two-dimensional lenses into three-dimensional reality. Just like a picture frame has much more to it than just width and height, a camera does too.
How far back from your fence do you want the camera? What’s the difference between 3 feet vs 10 feet away from your house? And if you get it wrong, people will be able to walk under your nose without setting anything off. Get it right? You need to know how corners gobble up coverage that looks fine on a flat wall. Field of view also shrink as the distance gets farther away.
How to Plan Your Security Camera Setup
It’s easy to screw this up in real life because the basic math behind it isn’t so hard to understand. First, you have to realize how far away the camera can see (the width of its view). Then you must consider that if you simply put two cameras next to one another they won’t necessarily overlap, so you’re going to lose out unless the two side-by-side cameras covers some amount of the same area (because without that shared ground, you create “seams” where activity slips through). Unless there’s some shared ground visible between two adjacent camera, things will fall into these seams unnoticed.
To avoid all that, our calculator here does the trigonometry for you based off your lens specs and the dimensions of your perimeter. It will help prevent you from having to guess at how much overlap you actualy need to cover or work out tangent functions by hand.
Also: Corners aren’t perfectly straight, and their angle matter more then what might be specified on the box. The big tradeoff here is in choosing your lens. A wide angle seems attractive, fewer units covering more ground. But wider means less detail. With a really wide lens you can see that somebody is standing on the other side of fence, but it’s going to be hard to tell who that person is if you’re fifty feet away.
To keep things clear and large enough to identify subjects, you’ll need narrower lenses and therefore more cameras to cover any given length of fence. Which brings us back to deciding which part of the perimeter matters most: identification or broad surveillance? That determines all the rest of the numbers in the equation.
The other place most people under-invest is in overlaps. If you leave a 5% gap between vantages, that looks like an efficient use of resources, but what you get is a ring of vulnerabilities around the home. Depending on the importance of the location, most pros shoots for 20-30% overlap. That’s higher overlap = more cameras = higher price tag, but also more certain than a single point going down without leaving a dark patch somewhere. You can slide this % with the tool and see how fast the number of camera climbs when you start demanding higher and higher levels of redundancy. It’s a pure financial equation of your budget limits against security density.
Lines break at corners. Covering corners is an exception to the linear approach; it’s one reason you might see extra units or mount cameras on either side at an angle. Turning points are where breaks are most frequently observed, so there’s a corner top-up factor in the calculator to account for them. If not accounted for, what would of appeared to be a bulletproof system on paper turns out to have gaps in reality.
The silent killer in any security plan is blind spots, those areas where you may think that 3 feet isn’t much but what happens when someone can move through that gap faster than your motion detection registers? Having an idea of how far apart is too far apart allows you to start visualizing where you absolutely need more. This will force you to see just how limited your options are with lenses before laying down any wire.
Formulas don’t account for real world variables either. Seasons change, trees grow, lighting varies day from night, etc. What looks good in bright summer sunlight may not work as well when it’s overcast or there’s lots of tree cover due to heavy leaves or long winter shadows. This is why we add some sort of safety buffer to our calculations. Better to be slightly over on cameras than out by several you can’t patch up once those wires is covered.
So first, measure what’s real, not estimated distance. Second, choose a lens that offers enough reach without sacrificing too much detail. Third, use the math to determine exactly how many units you should really buy to close the loop. Having cameras everywhere doesn’t equal good security. That means having them where they matter, overlapping where it counts, and leaving no place for someone to hide.
A few more unit carefully placed can make all the difference between a plan and a guess.