Automation Trigger Frequency Calculator
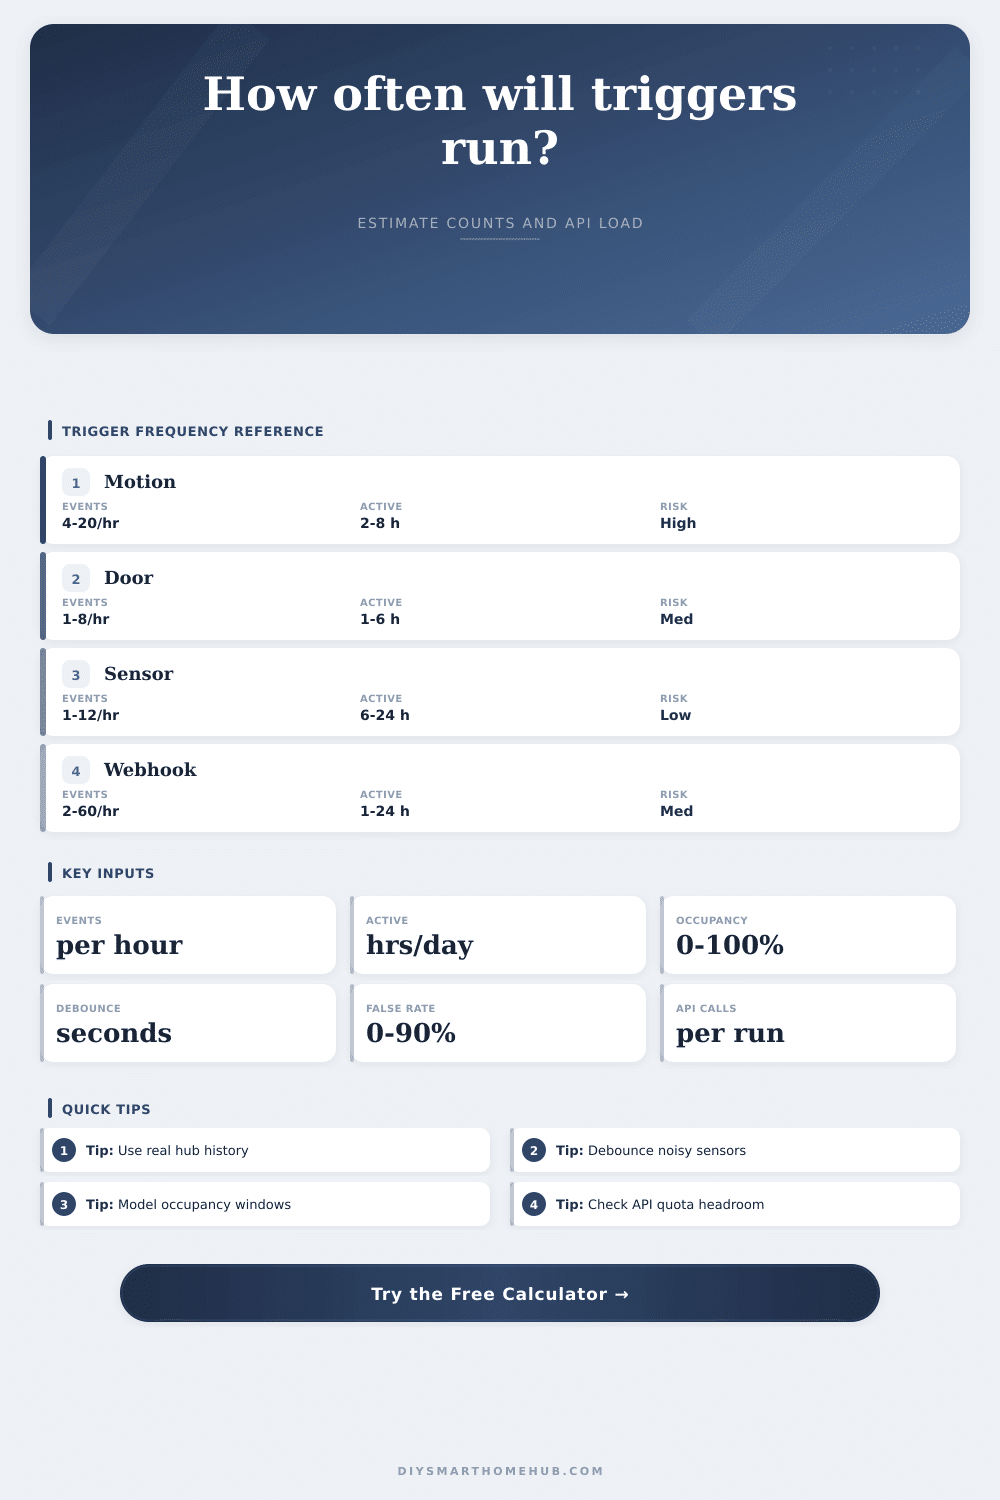
Estimate how many times a smart home automation will execute after source volume, active hours, occupancy, debounce filtering, false positives, and API calls are applied.
Trigger Frequency Results
| Source | Typical events | Debounce | Watch item |
|---|---|---|---|
| Motion sensor | 4-20/hr | 30-90 sec | Room traffic |
| Door contact | 1-8/hr | 5-30 sec | Repeated opens |
| Environment sensor | 1-12/hr | 60-300 sec | Threshold jitter |
| Camera event | 5-80/hr | 30-180 sec | Outdoor noise |
| Webhook event | 2-120/hr | 0-60 sec | Cloud bursts |
| Step | Formula | Output | Purpose |
|---|---|---|---|
| Raw daily | events/hr x hours | events/day | Start volume |
| Occupancy | raw x factor | eligible events | Presence gate |
| Debounce | events / block | coalesced | Noise control |
| False filter | coalesced x rate | executions | Usable runs |
| API load | runs x calls | call count | Quota check |
| Monthly runs | Band | Common fit | Review |
|---|---|---|---|
| 0-100 | Light | Manual scenes | Low load |
| 101-750 | Moderate | Rooms and doors | Normal log |
| 751-3000 | Busy | Motion zones | Debounce |
| 3001-9000 | Heavy | Energy checks | Quota math |
| 9000+ | Extreme | Bursty cloud | Rework rule |
| Calls/month | Pressure | Likely source | Action |
|---|---|---|---|
| 0-1000 | Low | Local hub | Track only |
| 1001-10000 | Moderate | Cloud device | Check quota |
| 10001-50000 | High | Logs plus alerts | Batch calls |
| 50001-200000 | Very high | Polling rules | Reduce rate |
| 200000+ | Critical | Event storm | Gate trigger |
Volume isn’t a native concept for most smart home users. Instead they envision specific scenarios, “The camera will save a clip whenever someone leaves a package”, or “I want the lights to turn on as I walk into a room”. That’s an event-based mental model that respond to changes in state.
Sounds easy enough… until you check your month’s worth of API logs. Maybe you’ll see that your hub is lagging at peak evening hours. Typicaly this happens because you underestimate just how many times those events occur. Bouts of quick activity get thrown into the mix along with false-positives and noise.
How to Count Smart Home Events
You believe your door sensor only opened twice a day, but maybe it was jittering five times a minute throughout a storm. This generate a flurry of commands flowing down the system. They fill up your automation history. And they consume your cloud quota without delivering much value.
After plugging in parameters for your behavior, as well as what limits how long your system can be running at any given moment, the calculator do the rest. No more guesswork about converting bursty days to a monthly total. You have to specify exactly what your automated system will do during its active window.
Few realize that occupancy gating can cut down on loads so effectively. If your motion sensor is only supposed to activate when you’re at home, you could apply an occupancy factor of eighty percent. Cut the possible number of executions by a fifth. A tiny change in the inputs makes a huge difference in results. This is why most folks miss this part. They spend all their effort thinking about the sensor hardware, not the logic gates between the event and the action.
Then there’s another seemingly technical but useful variable: debounce timing. Imagine if somebody walked past a motion detector in a crowded hall and it fire ten times per minute. Ten light toggles in a row would be overkill. You don’t want them switching on and off like that.
So you set a debounce window (say) at 45 seconds, which groups all those fast events together and executes one nice clean action. That’s what the tool is looking for; it takes this grouping into account. It reports how many events go missing from the raw data and are removed.
If you didn’t have this filter, you’d end up with bloated runs in your automation, full of redundant commands. It’s not about counting events; its about counting meaningful actions. Why does this matter? Because any needless run costs you some number of API calls and processing power. In a complicated setup with several device, that adds up fast.
False positives are the silent killers of efficient automation. A temperature sensor will bounce around slightly. That means you’ll get a heat-on command that’s turned off a few seconds later. A camera might detect a passing car every night, filling up your storage with footage of nothing. Your storage will fill with images of nothing.
The calculator allows you to enter a false-positive rate. It models the noise present in your physical environment. Even high-quality sensors emit noise, just less frequently. You don’t want to eliminate all random signals. You want to manage them. Make sure there aren’t too many to exceed your system’s capacity.
If you run into the heavy or extreme band on your monthly runs, it’s time to revisit the rules. Don’t simply buy better hardware. Cloud-dependent automations has to understand their API load. Each execution might trigger a single local command, but it could also initiate a webhook, a notification, and a log entry. That’s three API calls. Multiply quickly.
Use the reference tables on the page to classify what you’ve got going on, so you have some idea if you’re pushing things too hard. It’s okay if you’re running a weekend project at the moderate level of pressure. But for something like a home automation system that has been running for years, you need to run at the low or moderate level of pressure to avoid rate limiting when everyone else is using it. You want more than barely adequate; you want headroom.
So begin with what you can measure: Your own past. Create a log of a week’s worth of data from your busiest sensors and go from there. What did you really observe? More then likely, the answer is “more.” This surprises people.
Then, feed it into the model. Where are you stuck? How can a tighter occupancy schedule resolve a problem instead of buying another sensor? Adjusting a debounce window might do more than anything else.
Mostly it’s about knowing what you’re measuring. But automation isn’t doing everything in response to every signal. Automation is creating a system that responds to the intent of what its doing. If you can match your need and frequency to the trigger then all the rest becomes background noise. You get a house that responds but doesn’t feel swamped. That works if you manage how the events occur rather than just count them.