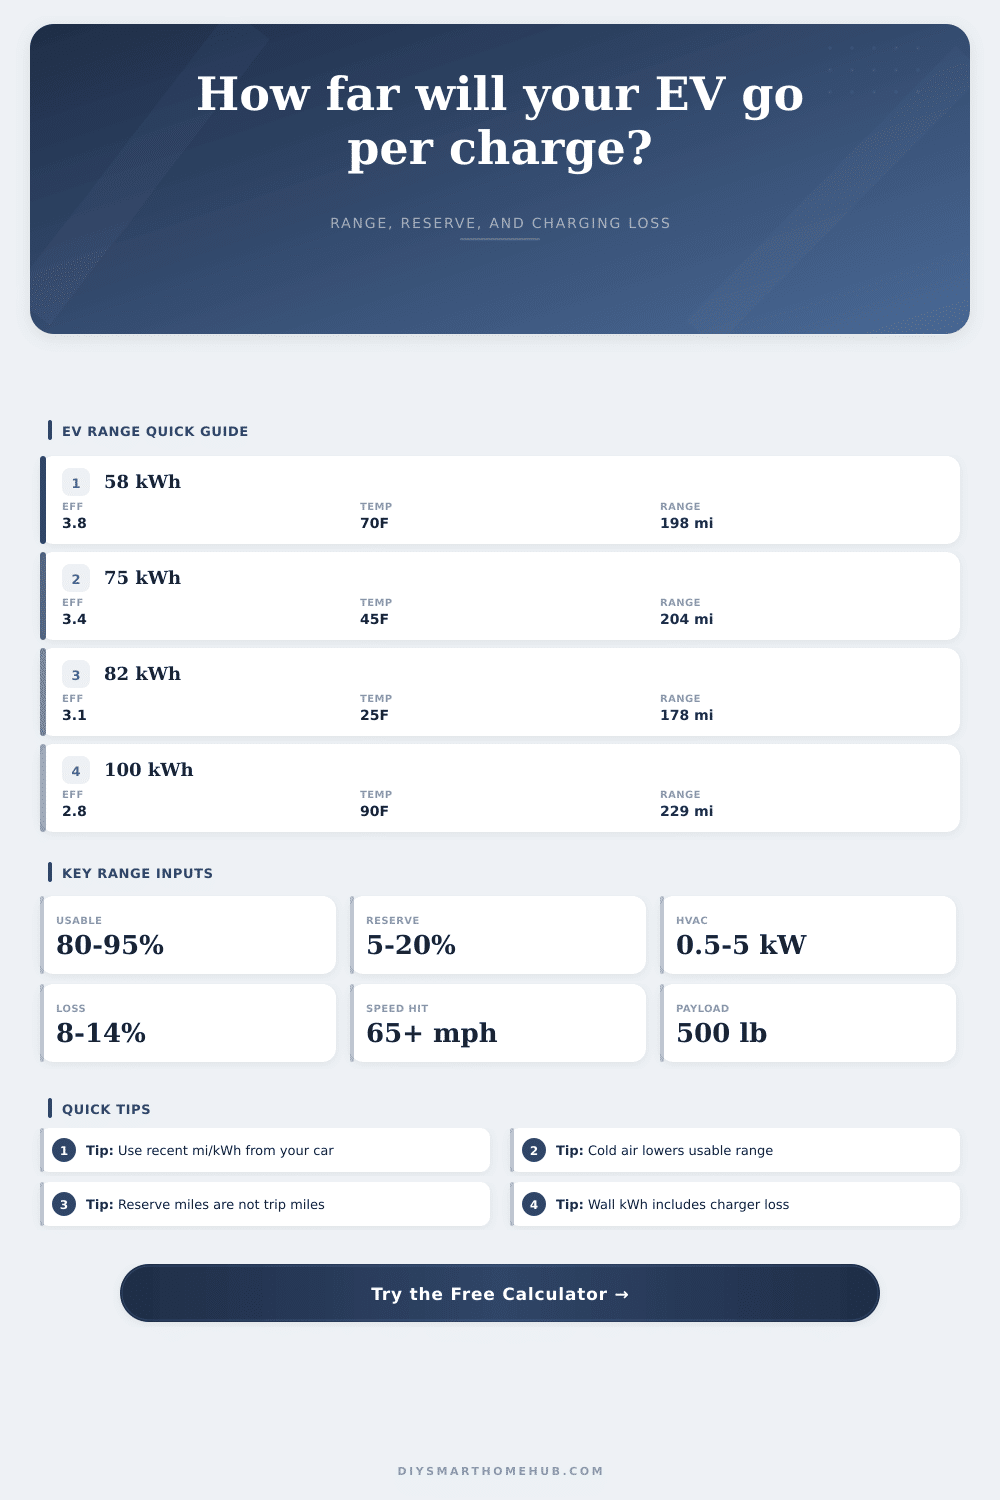
EV Range Per Charge Calculator
Estimate usable battery kWh, real-world range per charge, reserve miles, charger wall energy, and trip buffer after temperature, speed, HVAC, payload, and degradation adjustments.
Baseline efficiency bands
| EV type | Common mi/kWh | Common Wh/mi | Best use |
|---|---|---|---|
| Compact efficient EV | 3.8 to 4.8 | 210 to 265 | City, mild highways, efficient tires. |
| Midsize sedan | 3.3 to 4.2 | 240 to 305 | Mixed commuting and road trips. |
| Crossover or small SUV | 2.8 to 3.6 | 280 to 360 | Family driving, cargo, winter use. |
| Large SUV or pickup | 1.8 to 2.8 | 360 to 555 | Heavy payload, towing-free trips. |
Temperature adjustment guide
| Outside temp | Battery factor | HVAC clue | Range note |
|---|---|---|---|
| 75°F to 90°F | 0.98 to 1.00 | Light AC | Near-normal pack behavior. |
| 45°F to 75°F | 0.96 to 1.00 | Low load | Usually the strongest range band. |
| 20°F to 45°F | 0.82 to 0.96 | Cabin heat | Cold tires and heat reduce range. |
| Below 20°F | 0.70 to 0.82 | High heat | Preconditioning matters more. |
Highway speed multiplier
| Speed | Multiplier | Relative drag | Reading |
|---|---|---|---|
| 55 mph | 1.08 | Low | Good for stretching range between chargers. |
| 65 mph | 1.00 | Baseline | Normal highway reference point. |
| 75 mph | 0.85 | High | Fast cruising can dominate losses. |
| 85 mph | 0.72 | Very high | Use a larger reserve buffer. |
Reserve planning examples
| Reserve | Use case | Held back | Trip interpretation |
|---|---|---|---|
| 5% | Local errands | Small | Works when chargers and home are nearby. |
| 10% | Normal route | Moderate | Good for daily planning in familiar areas. |
| 15% | Road trip | High | Allows detours, wind, and charger spacing. |
| 20%+ | Winter or remote | Very high | Conservative planning for uncertainty. |
| Scenario | Battery and efficiency | Adjustment pressure | Likely usable trip range |
|---|---|---|---|
| Small city EV in mild weather | 50 to 60 kWh at 4.0 mi/kWh | Low speed, light HVAC | 170 to 230 miles after reserve. |
| Midsize sedan highway commute | 70 to 85 kWh at 3.5 mi/kWh | 65 to 75 mph cruise | 190 to 260 miles after reserve. |
| Crossover winter road trip | 75 to 90 kWh at 3.0 mi/kWh | Cold, heat, payload | 140 to 215 miles after reserve. |
| Large SUV family drive | 95 to 115 kWh at 2.4 mi/kWh | Speed and cargo | 175 to 260 miles after reserve. |
| Delivery route with HVAC | 65 to 90 kWh at 3.2 mi/kWh | Auxiliary load, stop-go | 170 to 250 miles after reserve. |
Battery energy
Usable kWh starts as battery kWh x usable percent. Degradation then reduces the current pack energy available for the range calculation.
Driving efficiency
Baseline mi/kWh should come from your own recent driving because tires, rain, elevation, and vehicle shape are already mixed into that number.
Auxiliary loads
HVAC watts subtract energy across the drive time, so the same heater load costs more miles when the route takes longer.
The calculator is strongest when baseline mi/kWh comes from the car on a similar route. Window-sticker range can hide tires, hills, rain, and your actual cruise speed.
Reserve miles are intentionally held back. The trip range card shows what remains after the reserve percentage is removed from adjusted range.
A heater may peak higher at startup and settle lower later. Use an average value for the whole drive, especially in very cold or very hot conditions.
Charger loss estimates how much energy the wall outlet or charging station supplies to refill the pack. It does not increase the energy available while driving.
Social media is riddled with reports of range anxiety. Everything is fine until the mercury dips into the single digits or you hit the highway doing an even eighty-five mph. And then the digital readout tells you that miles are dropping more quickley than expected. Forty minutes until the next charger, and watching the number of available mile tick down is rough.
Adding more battery doesn’t solve this problem. It’s about figuring out what percentage of the battery you think you can actualy use in certain situations. For most folks, reading sticker range equates to unchangeable fact. They aren’t right. Sticker range is a best-case scenario. These are flat roads, light winds, no snow, and mellow traffic. That stuff never happens when you’re out driving.
How to Calculate Your Real Electric Car Range
What you want is a means of modeling the factors who apply to your journey. When you fill out your trip information, the calculator does the rest. You will no longer fumble over conversions and coefficients. But knowing what those inputs mean gives you something better: insight.
So where to begin? Consider how much usable battery percentage remains. Often manufacturers leaves a healthy buffer on either end of the battery pack to preserve its life expectancy. You could have a seventy-five kilowatt-hour pack, yet only use sixty-eight as usable. If you don’t take this into consideration, your range calculations will always skew positive. It is a small detail but everything else starts here.
Electric range are very sensitive to temperature. Battery chemistry doesn’t work as efficiently when it’s cold. Driving the heat also consumes a lot of power. Outside temp controls allow you to adjust for this. It applies an efficiency multiplier to your estimate. When it’s twenty degrees outside, you’re battling cold air getting into vehicle. You’re also struggling with greater battery cell internal resistance. The reference table on the page spells it out clearly. A ten degree decrease can cost you several percent of your estimated range. It is not a bug, it is physics.
There are two other biggies: speed and cold. As the speed increases aerodynamic drag goes up exponentially. At seventy-five miles an hour, you’re much less efficient than when cruising along at fifty-five. It is not in a linear way; instead, it is a steep curve. The tool will adjust its efficiency rating based off your inputted speed. And yes, the efficiency number considers the greater amount of energy needed for pushing air out of the way. That’ll knock off a good chunk of your range (fifteen to twenty percent maybe). Increasing your cruise control speed saves time but it creates a tradeoff that you need to be aware of.
Remember the auxiliary loads. Cabin heating/cooling use energy. That doesn’t contribute to propelling your car. Running the heater at full blast for an hour uses a certain amount of kilowatt-hours. Those kilowatt-hours could of moved you forward five or ten miles. You can put a “typical” HVAC power draw in the calculator. This is very important if you’ll be doing any winter driving.
Similarly, adding more than just yourself to the car increase its aerodynamic drag and rolling resistance (think: roof box, luggage, passengers). Sounds small, but it compounds with the speed factor.
Last, think about charger efficiency: Not everything that comes out of the wall goes into your battery when you plug in at home or a public station. Part of it gets converted to heat. The tool shows that. It will tell you how much energy you have to pull off the wall to fill up your battery. That lets you better guess how long it will take, and how much it might cost to charge. You aren’t just paying for the fuel that propels your vehicle. You’re also paying for the fuel it takes to get the fuel there.
When you consider those things when planning your trip, it takes guessing out of the equation. Hope is no longer an option, data is now your friend. The sticker range is a marketing number. Your calculator’s range is a plan. It’s the distinction between pulling into your destination confidently or frantically hunting for a quick charge in a parking lot. It’s what shows you your car’s real range adjusted to your speed, load, and temperature. It gives you clarity while driving and that’s how you get rid of range anxiety.