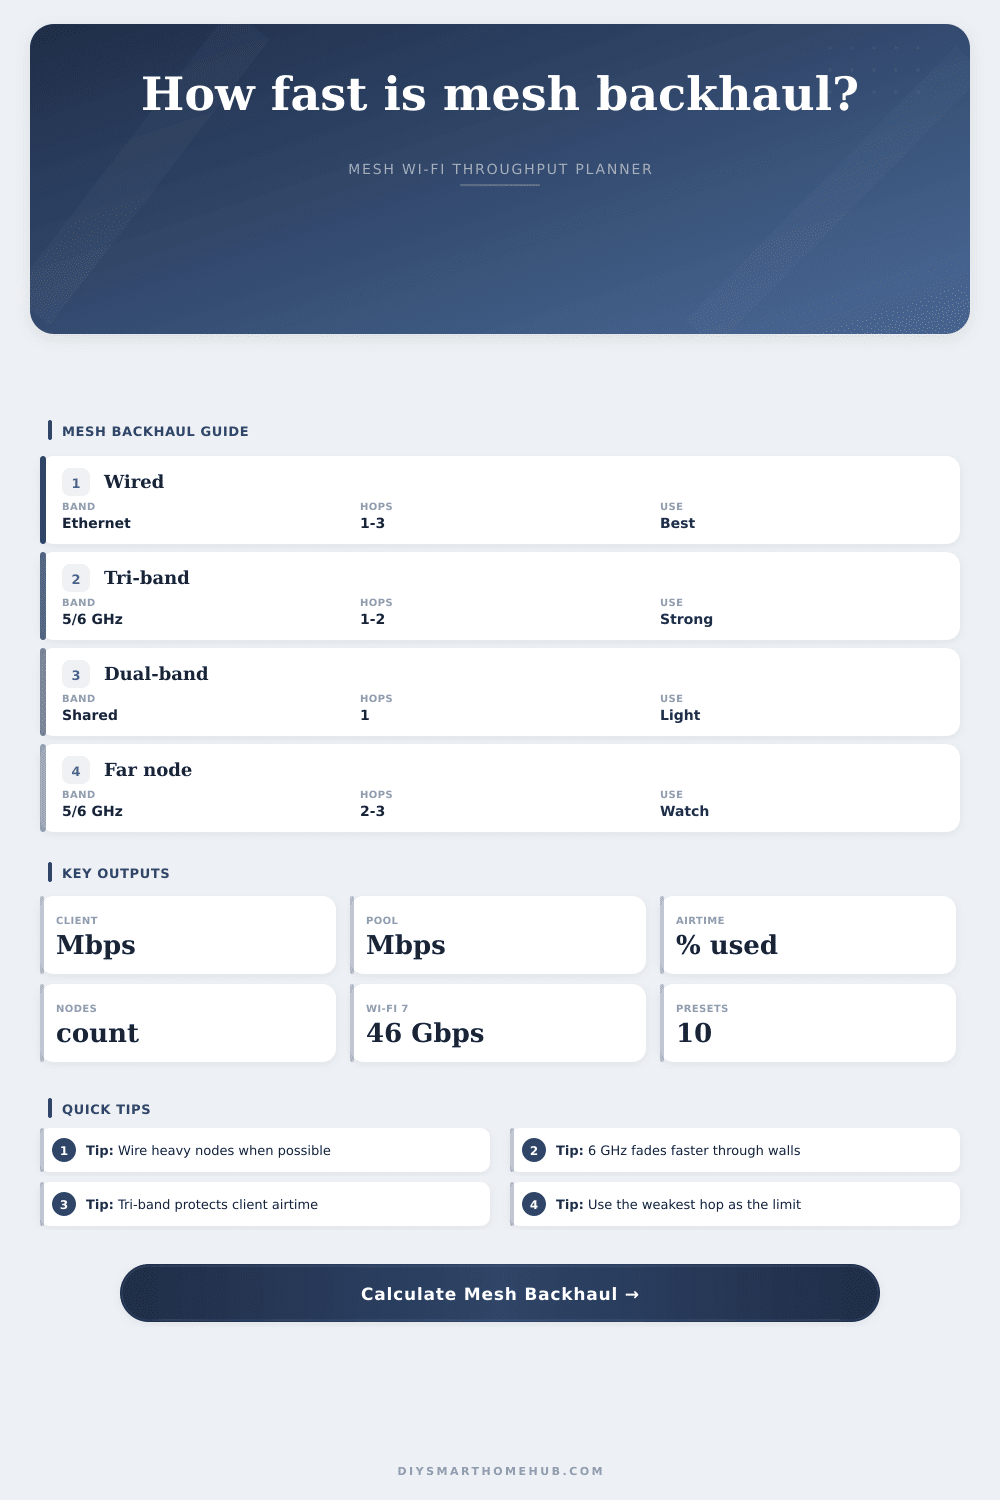
Mesh Backhaul Bandwidth Calculator
Estimate client throughput after mesh backhaul hops by comparing wired backhaul, shared wireless backhaul, tri-band dedicated backhaul, Wi-Fi generation limits, 5 GHz and 6 GHz range derates, airtime sharing, and node capacity.
Good for short one-hop backhaul and lighter client counts.
Better scheduling and higher practical node capacity.
Clean 6 GHz channels, but range derates faster through walls.
Wide channels and high headroom for dense mesh rooms.
Wi-Fi / mesh standard table
| Standard | Max PHY used | Planning efficiency | Mesh planning note |
|---|---|---|---|
| Wi-Fi 5 / 802.11ac | 3.5 Gbps | 48% to 58% | Works for simple one-hop nodes; shared backhaul loses airtime quickly. |
| Wi-Fi 6 / 802.11ax | 9.6 Gbps | 58% to 68% | Better airtime scheduling for busy homes and many clients. |
| Wi-Fi 6E / 6 GHz ax | 9.6 Gbps | 62% to 72% | Clean spectrum helps, but 6 GHz range derates faster with walls. |
| Wi-Fi 7 / 802.11be | 46 Gbps | 65% to 78% | Best dense-room headroom when clients and mesh nodes support it. |
Range derate table
| Band/range | Derate factor | Use case | Formula role |
|---|---|---|---|
| 5 GHz nearby | 0.82 | Same floor, light walls | Strong default for wireless backhaul. |
| 5 GHz far room | 0.58 | Longer room-to-room path | Reduces link rate before airtime share. |
| 6 GHz open | 0.90 | Same room or open plan | Clean high-speed backhaul. |
| 6 GHz through walls | 0.68 | One to two interior walls | 6 GHz capacity drops faster with obstruction. |
| 6 GHz far room | 0.45 | Distant node placement | Often the weakest-hop limiter. |
| 2.4 GHz fallback | 0.40 | Range-first fallback | Stable reach, low backhaul throughput. |
Preset comparison grid
| Preset | Type | Hops | Per client | Status |
|---|
Formula reference
| Formula | Calculation | Input source | Output |
|---|---|---|---|
| After-hop throughput | link rate x efficiency / backhaul hops | Link, efficiency, hops | Raw wireless backhaul |
| Range derate | after-hop throughput x 5/6 GHz derate | Band and placement | Weak-hop estimate |
| Airtime sharing | derated backhaul x airtime share x mode factor | Airtime and mode | Usable wireless pool |
| Wired backhaul | Ethernet speed x 0.94 | Wired speed input | Stable wired pool |
| Node capacity | active clients / (nodes x clients per node) | Nodes and clients | Capacity load |
Your router doesn’t quite cover every room of your house so you invest in a mesh Wi-Fi system. You set up those satellite nodes, run the app and everything is connected. You check the speed out in that remote bedroom and, yikes! The speed are very slow.
Don’t worry, your internet plan (and probably even your router) isn’t the culprit here. It’s called backhaul and it refers to the node-to-node connection.
Why Your Mesh Wi-Fi Is Slow
Use this tool to troubleshoot the issue before you spend money on new hardware or blame your internet provider. People tend to think if they have bars of signal, then it’s moving their data. Signal strength ≠ bandwidth. A bar indicate how strong the connection is.
Enter in your hop count and link rates into the calculator and it will do the math for you. You don’t need to guess about complicated conversions. You can see where each wireless hop is taking up airtime that might otherwise be used by your devices. If you choose a shared backhaul, the tool will divide the bandwidth between node-to-node traffic and what you use with your devices. It’s a zero-sum game on radio spectrum.
The inputs has more value than the outputs. They expose your bottlenecks. This is your real PHY link rate, not theoretical maximum on the box. Lab tests have Wi-Fi 7 going very fast. That doesn’t help you when you’re nowhere near main node.
Walls block higher frequencies, and the tool shows this by reducing expected range. Five gigahertz is the compromise; two point four gigahertz is the fallback. Five gigahertz is the compromise. Two point four gigahertz is the fallback. Your backhaul may be at 6 GHz but now it’s behind two walls so your performance drops like a rock. Marketing says nothing about physics.
Performance-wise, hops also matter. Efficiency drop each time data has to jump from one node to another. The calculator takes your bandwidth and divides it up based off how many hops there are. That’s why you’ll sometimes find that daisy-chaining three nodes slows things down different than running one good node. Relay overhead can make it so that even though you’re paying for gigabit speed, you still have slow connections.
And then there’s client density. When you’ve got thirty-two devices sharing the same radio, the airtime gets chopped up into tiny little fractions. That’s why a node with full bars can be slow if everyone is gaming or streaming.
But wired backhaul alters the calculation. By running an Ethernet cable to your satellite node, you eliminate the airtime sharing penalty on that link. Wired links is considered stable by the calculator, they don’t degrade due to walls or distance. That is why it would of been the best option. When wiring up the nodes, route traffic-heavy ones. Wireless backhaul will suffice for the rest, which only need occasional phone calls and smart home sensors.
You can see how various layouts fare through the tool’s presets. In general, a dual-band layout will do worse than a tri-band setup with dedicated backhaul band. Why? Because it segregates relay traffic from client traffic. When you’re gaming from the office, this matters.
If the results indicate low throughput, reduce the hop count (i.e., move the nodes closer together) or increase the number of wired nodes. The idea isn’t to achieve maximum paper physical rate. The idea is to get enough airtime that makes it to your devices instead of getting gobbled up by the mesh network itself.
You want speed that actualy arrives.