Growing Degree Days Calculator
Estimate daily growing degree days, multi-day heat accumulation, crop-stage progress, and remaining days using Fahrenheit or Celsius temperatures with an optional upper cap.
Calculation breakdown
Field crop tracking
Use accumulated GDD from planting to compare emergence, vegetative growth, and reproductive stage progress across similar plantings.
Greenhouse sensors
Use hub temperature logs to estimate heat units inside a protected growing area rather than relying only on outdoor weather stations.
Pest biofix models
Start the prior total at zero on the biofix date, then track accumulated heat units toward monitoring thresholds.
Garden planning
Compare warm and cool periods to decide whether a crop is moving quickly enough toward a harvest or transplant stage.
| Formula step | Expression | Input used | Output meaning |
|---|---|---|---|
| Unit conversion | °F = °C x 9 / 5 + 32 | Metric temperature entries | Common internal scale |
| Upper cap | min(temperature, cap) | Tmax, Tmin, optional cap | Limits heat above crop range |
| Daily average | (capped Tmax + capped Tmin) / 2 | Daily high and low | Mean daily heat condition |
| Daily GDD | max(0, average - base) | Average and base temperature | Heat units gained per day |
| Accumulation | prior + daily GDD x days | Prior total and period length | Progress toward target |
| Crop or model | Common base | Common upper cap | Typical use |
|---|---|---|---|
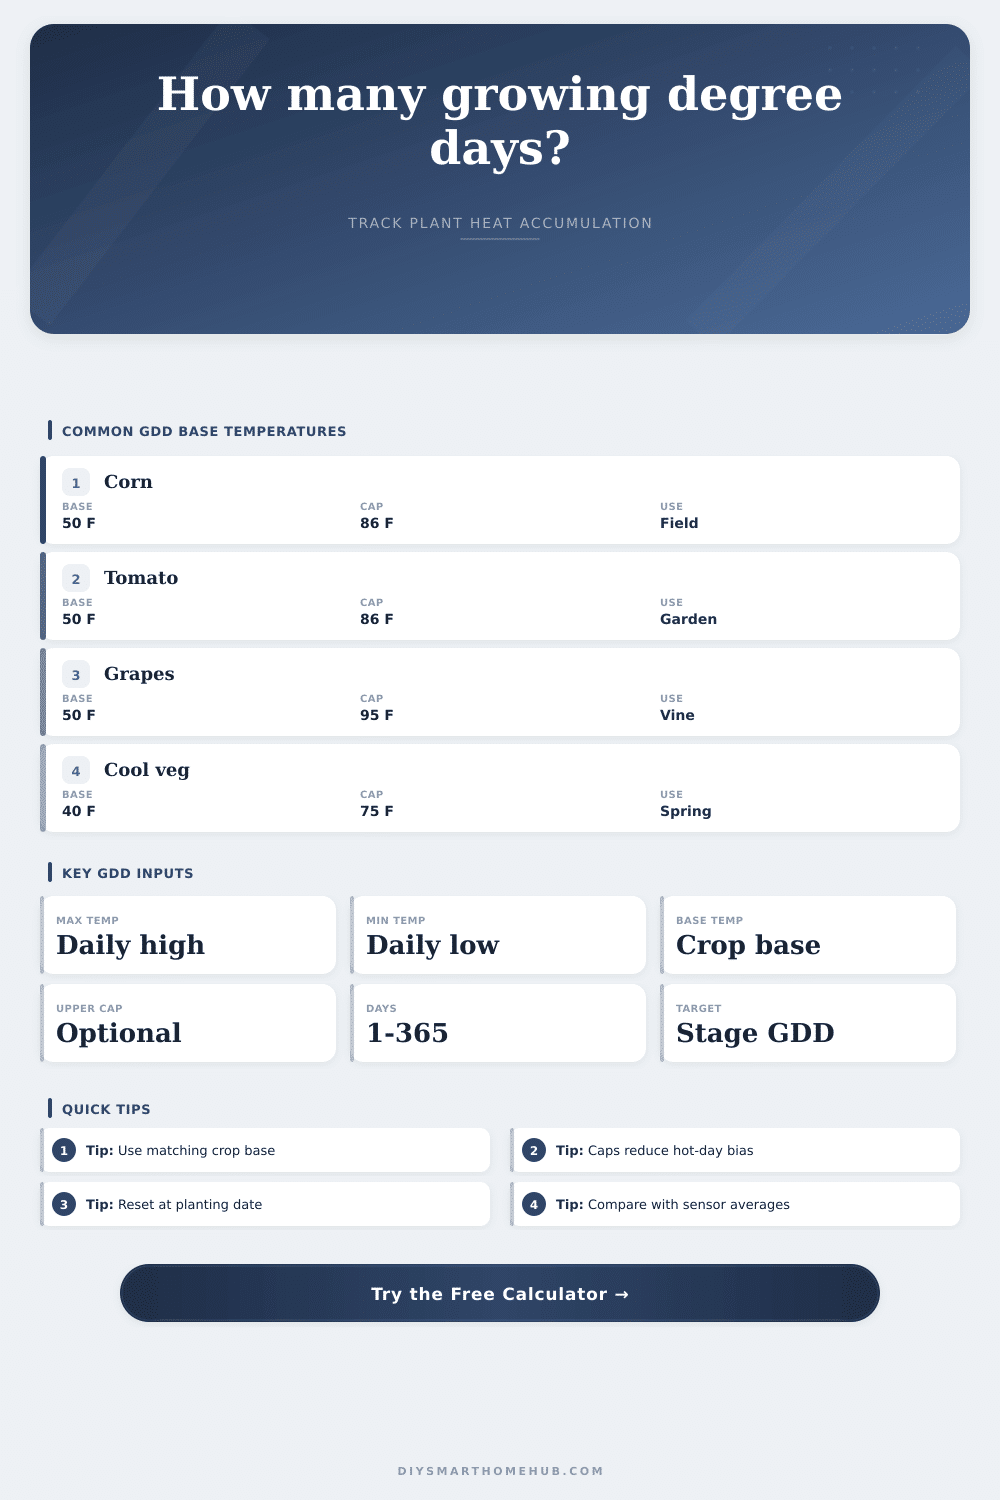
| Field corn | 50°F / 10°C | 86°F / 30°C | Emergence, leaf stages, silking, maturity tracking |
| Tomato | 50°F / 10°C | 86°F / 30°C | Transplant progress, flowering, fruit development |
| Grapes | 50°F / 10°C | Often 95°F / 35°C | Budbreak, bloom, veraison, harvest planning |
| Cool-season greens | 40°F / 4.4°C | 75°F / 23.9°C | Spring and fall crop pacing |
| Crabgrass model | 50°F / 10°C | No cap or local model cap | Lawn threshold monitoring from seasonal start |
| Codling moth model | 50°F / 10°C | 88°F / 31.1°C | Biofix-based orchard heat accumulation |
| Scenario | Temperature pattern | GDD behavior | Best adjustment |
|---|---|---|---|
| Cool spring week | Highs near 58°F and lows near 42°F | Low daily GDD with a 50°F base | Use multi-day accumulation to see slow progress |
| Warm greenhouse day | Highs near 84°F and lows near 66°F | Strong daily heat gain for warm crops | Use sensor data from the growing zone |
| Hot afternoon spike | Tmax rises above the crop upper threshold | Upper cap prevents overstating useful heat | Enable the cap used by your crop model |
| Cold night setback | Low temperature drags down the daily average | Daily GDD may be small or zero | Check sensor lows, not only daytime highs |
| Target stage close | Accumulated total is near the target | Progress percentage can change quickly | Update temperatures with current daily data |
| Preset | Base temp | Target GDD | Planning focus |
|---|---|---|---|
| Corn emergence | 50°F / 10°C | 120 GDD | Early field progress from planting |
| Corn silking | 50°F / 10°C | 1400 GDD | Seasonal heat accumulation |
| Tomato fruit set | 50°F / 10°C | 650 GDD | Warm garden development |
| Grape budbreak | 50°F / 10°C | 150 GDD | Vineyard sensor monitoring |
| Cool-season greens | 40°F / 4.4°C | 300 GDD | Spring bed growth pacing |
It’s spring by the calendar, but it’s still too cold out there to get seed going in the soil. Or you could wait until nature warms things up, or figure out growing degree days to estimate the right time for each crop to pop from the earth.
Growing degree days transform weather information into biological activity, into an estimate of how far along plants has progressed, so you can compare your timeline with their development. This calculator up top do the math: It takes daily highs and lows and turns them into one number (to follow your progress along the way). No more guessing if that week of extra-warm weather was enough to coax the tomato plant to start producing fruit, or not.
How Growing Degree Days Work
It’s an easy enough idea at heart: a plant has a minimum number of heat units required to grow, and you have a minimum number of hours of sleep that you must gets to be able to function. That minimum point where development stops is called the “base temperature.” For corn, the base would typically be fifty degrees Fahrenheit. For lettuce or other cool-season greens, it could be forty. So if the average daily temperature are below base, the plant basically takes a nap. Every degree above the base counts as a day toward the goal, so every extra hot day help.
But here’s the tricky part: What are we counting? Just hot days? No. We’re measuring how much good warming the plant actualy gets over time. But here’s where it gets tricky: Just because it got really warm doesn’t mean much. It could have been super-warm in the middle of the day, which doesn’t mean much if it cooled way down at night. This could bring that overall average back below base. On the flipside, say it never gets crazy-hot or cold all week; maybe it stays just kinda-mild, day and night? Well, those are conditions when daily heating might build up into more growth than an occasional wild swing from one end of the scale to the other. So yes, the tool needs both highs and lows. The min and maxes; to work properly. Not just high number from your weather app! It wants the whole picture, so it averages these two numbers together, minus the base temperature, then outputs the daily heat units. Enter more than one day’s worth, and it will add it up and give you how many it has accumulated so far toward a given stage of growth.
Everyone who has tried tracking these makes one mistake: they forget to add in an upper limit to their temperature.” Beyond some point, most plants don’t benefit from added heat. If the air outside is ninety-five degrees, for instance, there’s no reason to think your corn will get bigger. It just stresses the plant with waste-energy heat. That’s why there are caps… Shown on the page’s reference table, for all of them: caps like ninety-five degrees for grape vines, or maybe eighty-six for corn. A cap keeps you realistic; without it, you may think your crop is already three weeks ahead of time, but realy it’s right on target.
The right preset matters. To use your trap with pests like codling moth in the orchard, for instance, you count from what’s called a biofix date (typically when the first moth shows up in one of your traps). You start again at zero heat units, reset by previous total. Then you watch for those heat units to build up again until they reach a number that tells you when to apply pesticide. For gardeners: Depending on what you’re doing, perhaps you want to count until the plants produce fruit; you would of started on the day of transplant and watched how it goes from there. Though the math is similar, where you begin depend on the context. That’s key. Get the beginning wrong and the whole prediction is useless.
It will also convert units for you as a tool. You want to use Celsius? No problem, the biology isn’t any different. Want to use Fahrenheit? Okay, that won’t change the underlying biology either. The calculator just adjusts for you. That’s nice when you’re trying to compare information collected from different places or perhaps different countries. Do I have my greenhouse up to temp? Am I falling behind compared to county average for my field corn? This makes it easier to do and look at what the trend is versus doing all of the math.
So in the end, there is nothing more precise than counting grow degrees to tell you just how patient one must be, and to realize it’s nature, not yourself, who is running the clock. Yes, you can weed and water to prepare ground. But you can’t hurry up the build-up of those degree days. There is the certainty of method that comes with tracking heat units. No more fretting over “too soon” or “too late,” because you’re watching the digits tick upward, and you know the seeds will appear when they’re good and ready. And you’ll see precisely when that moment arrives.