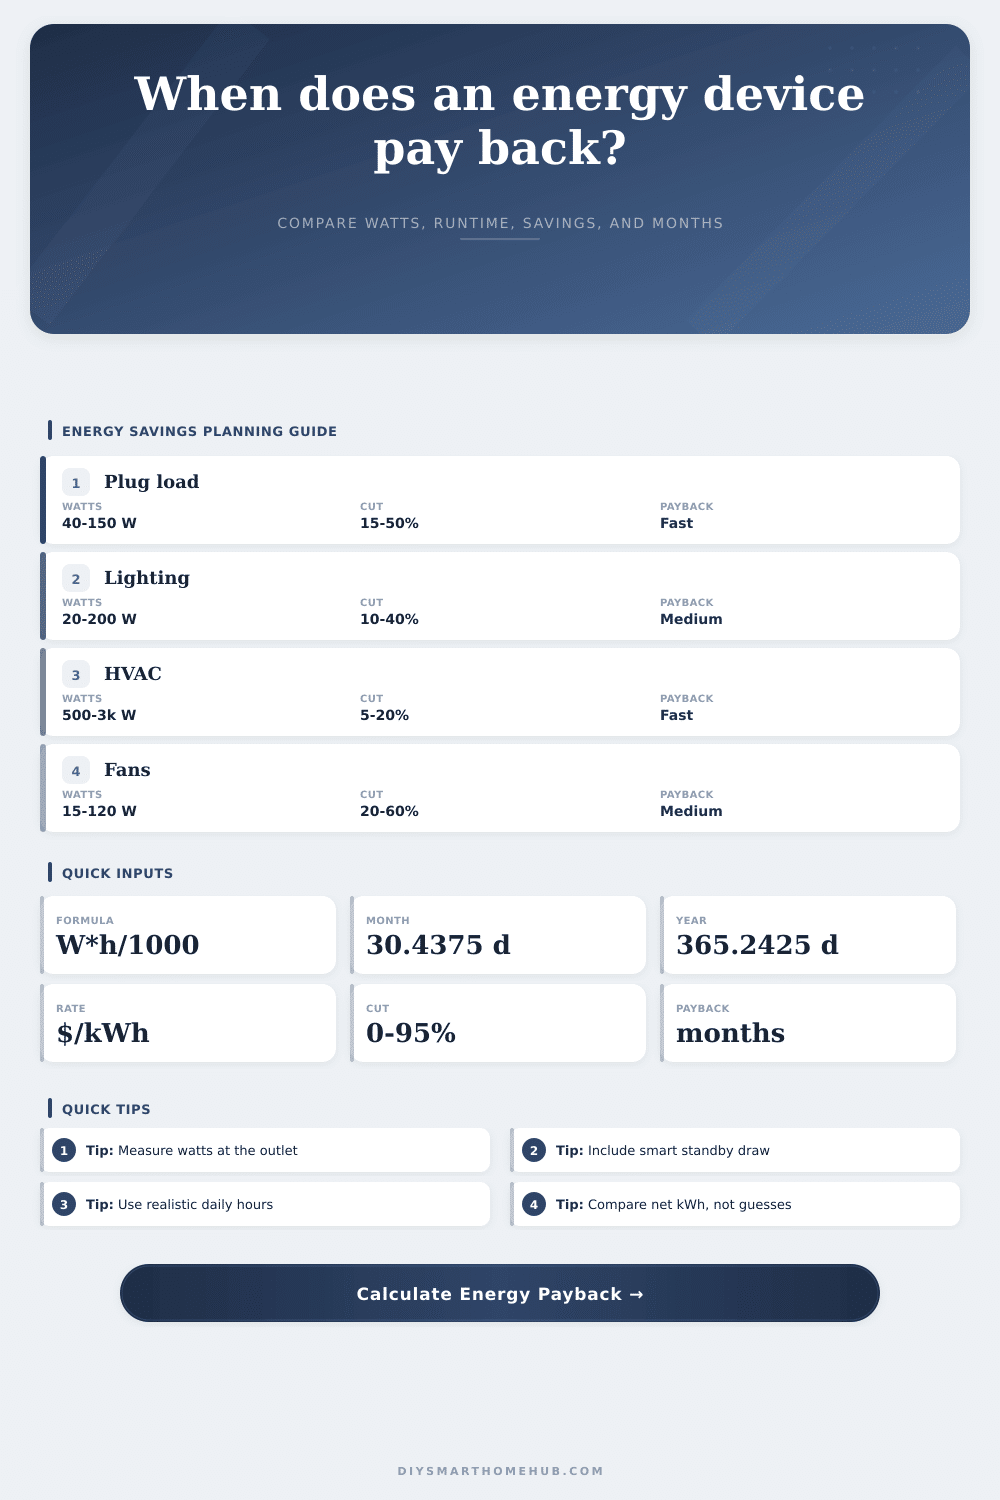
Energy Savings Payback by Device Calculator
Estimate device-level energy payback from baseline watts, smart-device watts, daily runtime, duty-cycle reduction, electricity rate, standby draw, and upfront amount.
| Step | Formula | Unit | Use |
|---|---|---|---|
| Baseline kWh/day | W * h / 1000 | kWh | Original use |
| Smart active kWh/day | W * h * duty / 1000 | kWh | Controlled use |
| Standby kWh/day | W * h / 1000 | kWh | Module draw |
| Payback months | Amount / monthly savings | months | Recovery time |
| Device type | Active watts | Smart watts | Good cut |
|---|---|---|---|
| Thermostat | 500-3000 W | 1-5 W | 5-20% |
| Scenario | Baseline | Cut | Typical read |
|---|---|---|---|
| Thermostat setback | 1800 W | 12% | High leverage |
| Office power strip | 90 W | 55% | Long hours |
| Bathroom fan timer | 70 W | 45% | Behavior fix |
| Outdoor lighting timer | 240 W | 35% | Seasonal use |
| Metric | Daily | Monthly | Annual |
|---|---|---|---|
| Net saved | 0 kWh | 0 kWh | 0 kWh |
| Smart use | 0 kWh | 0 kWh | 0 kWh |
| Baseline use | 0 kWh | 0 kWh | 0 kWh |
If you’re like me, you’ve got at least one smart plug hiding behind your TV and maybe even a smart thermostat that’s learned your schedule. You bought them because they help the environment, save electricity, and make you feel more in control, but do they really? Do any of these gadgets ever pay for themselves? In most cases, I doubt you know. And yet there you sit, hoping they do.
The payback period is what makes all this worthwhile: It transforms a fuzzy sense of efficiency into a tangible financial proposition. With every upgrade, you’ll finally know where you stand financially instead of just guessing. When will you break even?
How to Know if Your Smart Gadgets Save Money
Measuring the baseline is the first step. You’d be surprised how many folks just assume their device’s wattage matches its nameplate rating. That’s wrong. Average watts does not equal nameplate rating watts. Your space heater may display a nameplate of fifteen hundred watts, but that doesn’t mean it draws an average of fifteen hundred; it turns itself on/off as necessary to keep warm, so its average watt draw is much less. Once you enter your realistic average watts, the calculator figure out the rest. This difference between the two is critical, because this splits reality from theory.
If you use an inaccurate watt number, then you’ll believe you’re saving a ton more money than you actualy are. You won’t see those savings reflected in your bank account. Your optimistic-looking spreadsheet makes your bank account look pessimistic.
And then there’s the automation piece, which is where the smart bit gets smart. This is where it actualy does something. Here we’re talking about turning things off when they’re idle (the TV), setting back the run-time on the HVAC, dimming lights… whatever. You give the tool a percent to reduce the duty cycle, meaning how much time you’re willing to cut from the thing’s waste. If I forget to turn my bathroom fan off and it wastes an hour running after I’ve left the shower, the timer can slice that down to ten minutes. Huge reduction in runtime there. The secret is knowing what you’re really measuring, because it isn’t just wattage you’re reducing, it’s hours of using electricity. Reducing the run time and lowering the wattage hits your energy bill twice.
Another thing that’s the silent killer of an efficiency project is the standby draw. Wi-Fi enabled sensors, switches, or even just smart plugs all requires power just to be online. Typically only one or two watts, but as with any number multiplied times twenty-four and then three hundred sixty-five, it adds up. The calculators take this into account automatically. They deduct the overhead of the controller from the gross savings to give you net reduction. That is what folks miss. They’ll figure out how much savings come from turning the light bulb off, but they don’t factor in how much energy the smart switch itself require to turn the light bulb off. In fact, if the controller load isn’t very big, the controller may end up consuming more energy than it saves.
The last piece of this equation is your local electricity rate. That’s what multiplies your savings from that kilowatt hour. Is one kilowatt hour more valuable if you live in an expensive energy market then if you live in a cheap market? You bet. The tool allows you to plug-in your exact rate, which converts these physical units (kilowatt-hours) into monetary ones. This connects physics to money by showing exactly when your initial investment will be paid back by your monthly savings. A plug might pay back within three months; a whole-home system might pay back over two years. It all depends on your budget and your timeline. Either can be great.
On the page it breaks this down with a reference table that shows typical ranges for various types of device. For example, plug loads tend to have pretty quick paybacks. Since they save energy during lots of idle time. HVAC pays back more slowly but offers a larger total saving. And lighting is somewhere in between. So use those averages as a sanity check on what you enter. If it’s wildly different than the average, you’ve probably got something wrong (or maybe you’re uniquely inefficient), but either way the data will help you make a decision about it.
The point of energy efficiency isn’t to buy the shiniest gadgets. The point is to go after waste. Identify the things that suck up the most electricity and have the longest runtime. Take precise measurements and account for the power used by the controller. Then, use those numbers when making a purchase decision. If you do the math first, you’ll save more energy (and spend less money).