Smart Home Insurance Discount Savings Calculator
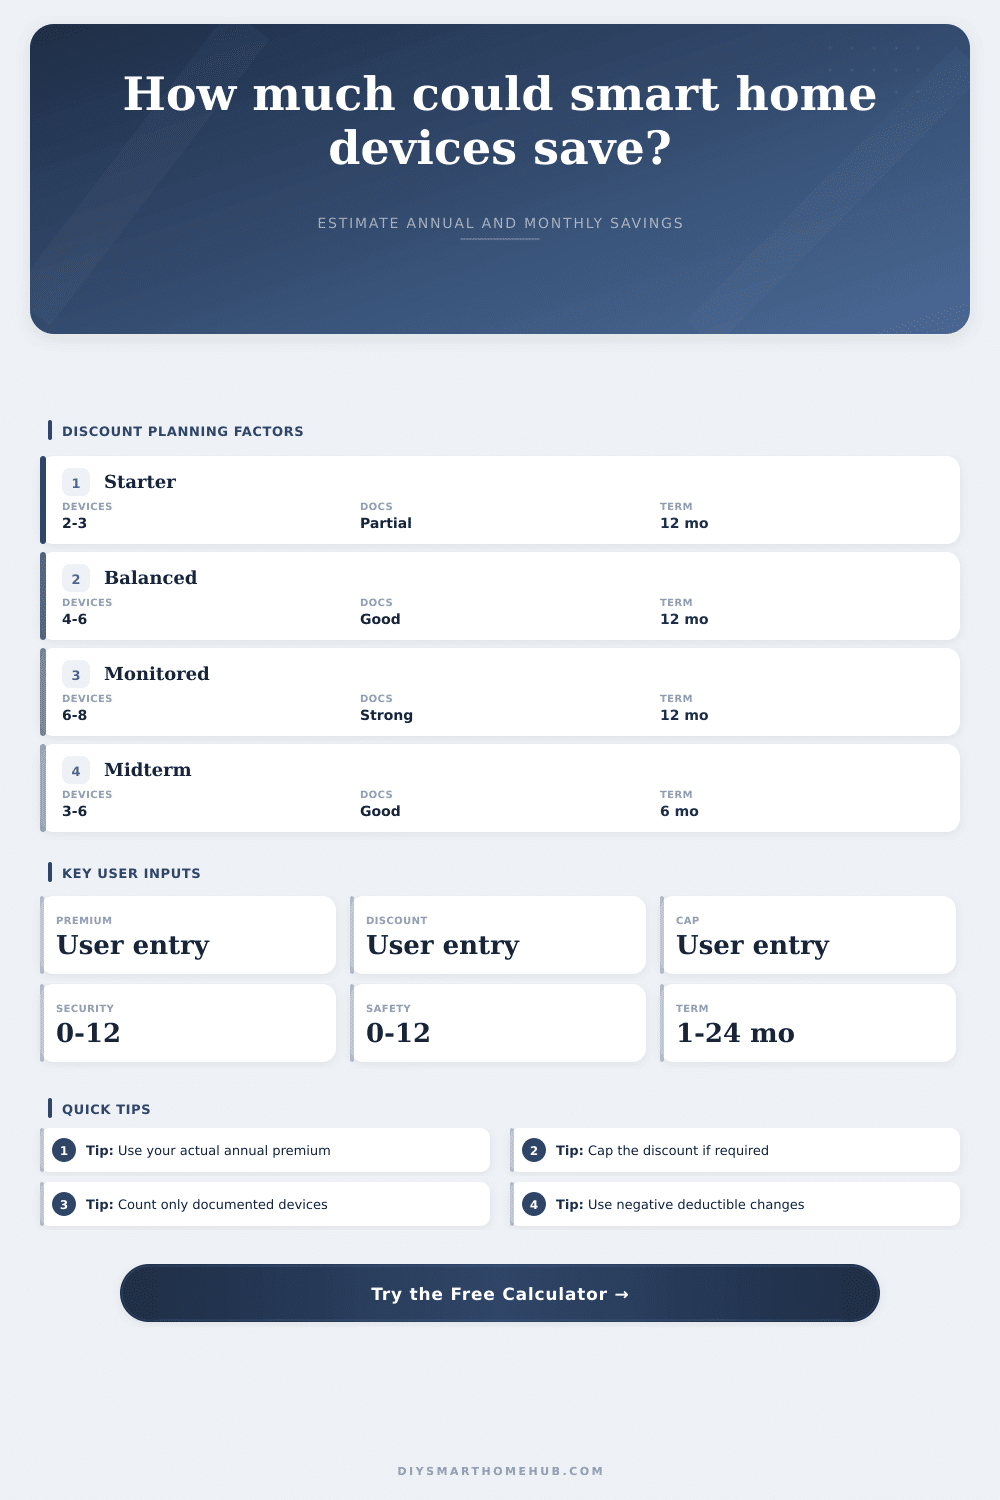
Estimate annual premium savings, monthly savings, term savings, and net impact from your own insurance premium, discount percentage, cap, device counts, monitoring status, deductible change, and documentation confidence.
Calculation breakdown
Quoted discount
The user-entered discount percent is the starting point. The cap field limits it before confidence and device readiness are applied.
Device readiness
Security and safety counts create a readiness score. A balanced mix gets full credit faster than a one-category setup.
Documentation confidence
Complete proof keeps the modeled discount close to the quoted value. Missing proof lowers the likely applied estimate.
Net savings
Annual discount savings are combined with deductible-related premium changes, then prorated across the selected term.
| Formula step | Calculator input used | How it is calculated | Output affected |
|---|---|---|---|
| Discount rate cap | Discount percent and cap percent | Uses the lower of entered discount and entered cap | Applied discount percent |
| Device readiness | Security count and safety count | Total documented devices compared with a six-device planning target | Likely applied savings |
| Confidence adjustment | Monitoring and documentation status | Planning multiplier reflects how complete the proof package is | Likely applied savings |
| Deductible impact | Deductible annual savings entry | Positive values add savings, negative values subtract savings | Net annual savings |
| Term proration | Term months entry | Net annual savings multiplied by term months divided by 12 | Term savings |
| Device mix | Security count | Safety count | Planning interpretation |
|---|---|---|---|
| Entry security | 2 to 4 | 0 to 1 | Good for checking a small quoted discount, but safety proof may be thin |
| Safety focused | 0 to 2 | 3 to 6 | Useful for leak, smoke, carbon monoxide, or temperature protection claims |
| Balanced smart home | 3 to 6 | 3 to 6 | Balanced category coverage usually gives the strongest planning readiness |
| Whole-home documented | 6 or more | 6 or more | Best for testing whether the cap, not device count, limits savings |
| Monitoring status | Planning multiplier | Documentation fit | Use this when |
|---|---|---|---|
| No monitoring confirmation | 0.85x | Device list only | You are modeling uncertain approval with limited confirmation |
| Self-monitored alerts | 0.92x | App screenshots | Alerts go to the homeowner but no certificate is available |
| Connected app alerts | 0.97x | Device and alert records | The system can show active devices and notification history |
| Professionally monitored certificate | 1.00x | Certificate packet | You have formal confirmation for the monitored system |
| Term length | Proration factor | Best planning use | Calculator output |
|---|---|---|---|
| 3 months | 25% of annual net | Late-term policy update or short renewal window | Quarter-term savings estimate |
| 6 months | 50% of annual net | Midterm device documentation or deductible change | Half-year savings estimate |
| 12 months | 100% of annual net | Full policy year or renewal comparison | Same as net annual savings |
| 24 months | 200% of annual net | Two-year planning view for a stable setup | Two-term savings projection |
It begins with one device, typicaly a smoke detector connected to your phone. Next, you add a water sensor under sink. Then comes a smart lock on the front door. You’ll have a house full of sensors sending alerts to your pocket. The pitch is all about convenience. But hiding behind the scenes is another quiet perk. Insurance companies LOVE data. Data means less risk. And insurance companies likes to REWARD customers who share this data … if they’re willing to clean up their paperwork first.
Enter our calculator above. It runs all the math for you. Take your premium, plus your device list, and boom. The calculator spits out a concrete estimate of how much you can save. No need to learn complicated formulas. It’s actualy proving the existence of the gadgets that’s the toughest task, not purchasing them.
How to Save Money on Insurance with Smart Home Devices
Insurers tend to be skeptical. Your app might say “green checkmark,” but so what? They’d prefer to see a list of model types, serial numbers, and preferably a certificate of monitoring. That’s when documentation confidence realy matters for your discount. No proof = no savings. Having a stack of devices isn’t enough if you can’t prove which ones is installed.
View setting up your smart home as similar to a mini-audit. Save those receipts. Take screenshots of your app dashboards. Log which device you’ve installed. It’s not much work, but when renewal day rolls around the financial reward arrives quickly.
To an underwriter’s eye, not all devices is created equal. Cameras and door sensors serve to deter theft, security. Smoke alarms and leak detectors help prevent catastrophic damage and improve safety. Generally speaking, a balanced mix indicates a lower overall risk level different than a single-focused system (e.g., 10 cameras and no leak sensors looks impressive but leaves your house vulnerable to water damage, a costly claim). For a stronger case for a higher discount, aim to create a spread across security and safety categories. Not only does it signal to the insurer that you’re not just watching out for intruders, but you’re also managing risk from multiple angles.
Another silent killer is caps. Most policies only apply smart home discounts as a percentage (usually something like 10%) with a cap. Depending on how many devices you have there may be a higher percentage discount you can earn. But then there’s the cap. That keeps the lid on it. This is why it’s important to enter a reasonable cap when you use the tool. You’re not banking on getting a bigger discount than the policy structure actualy allows. If you understand the cap, you’ll understand what you should of expect. This cap represents the highest discount allowed, not necessarily the highest one that is theoreticly possible.
Another issue is deductibles. In some cases, adding a smart system let you increase your deductible, so you reduce your premium even more. In others, the slightly higher cost elsewhere (a small increase in other fees) offsets the premium reduction you get from the discount. With the tool, it models the change in the deductible. So instead of just seeing the gross discount, you’ll see the net effect. That way, you know whether the math pencils out, or if increasing your deductible exposes you to too much out-of-pocket risk (more cashflow today vs. Less cashflow tomorrow).
It’s also practical: How long will it take? Is this something you’re rolling out over multiple years or just one year? Maybe shorter-term policies makes sense in midterms. Thinking long-term allows you to see how the stability builds up over time. Prorating reveals to you what these monthly savings equate to across the year. It turns a tiny dollar amount per month into a meaningful yearly figure. Often enough, that’s where you realize it makes sense to add another sensor.
In short, tech isn’t really the point when it comes to getting smart home insurance discounts; it’s all about talking to your insurer. You’re negotiating your risk profile with a company that is willing to pay to know what it is. And the gizmos? They’re just the proof. That’s where the heavy lifting occurs, in the documentation and the understanding of policy limits. Frame it like that, and it’s simple: plug-in, prove, send-in, save. Let the math do the rest. Go out with a lighter wallet and a safer house. It is a little win, but one that builds up.