Smart Home Installation Labor Hours Calculator
Estimate smart home installation labor from device counts, device complexity, wall material, attic or ladder access, app pairing, testing, rework buffer, and crew size.
Mounting is quick, but pairing, labeling, and room-by-room contact testing can dominate the total.
Wall box access and plate work push more time into installation than into app pairing.
Alignment, exterior mounting, ladders, and WiFi checks make site multipliers more important.
Use normal complexity, normal pairing, and a 12% to 20% buffer unless the house is already mapped.
| Device group | Simple | Normal | Advanced |
|---|---|---|---|
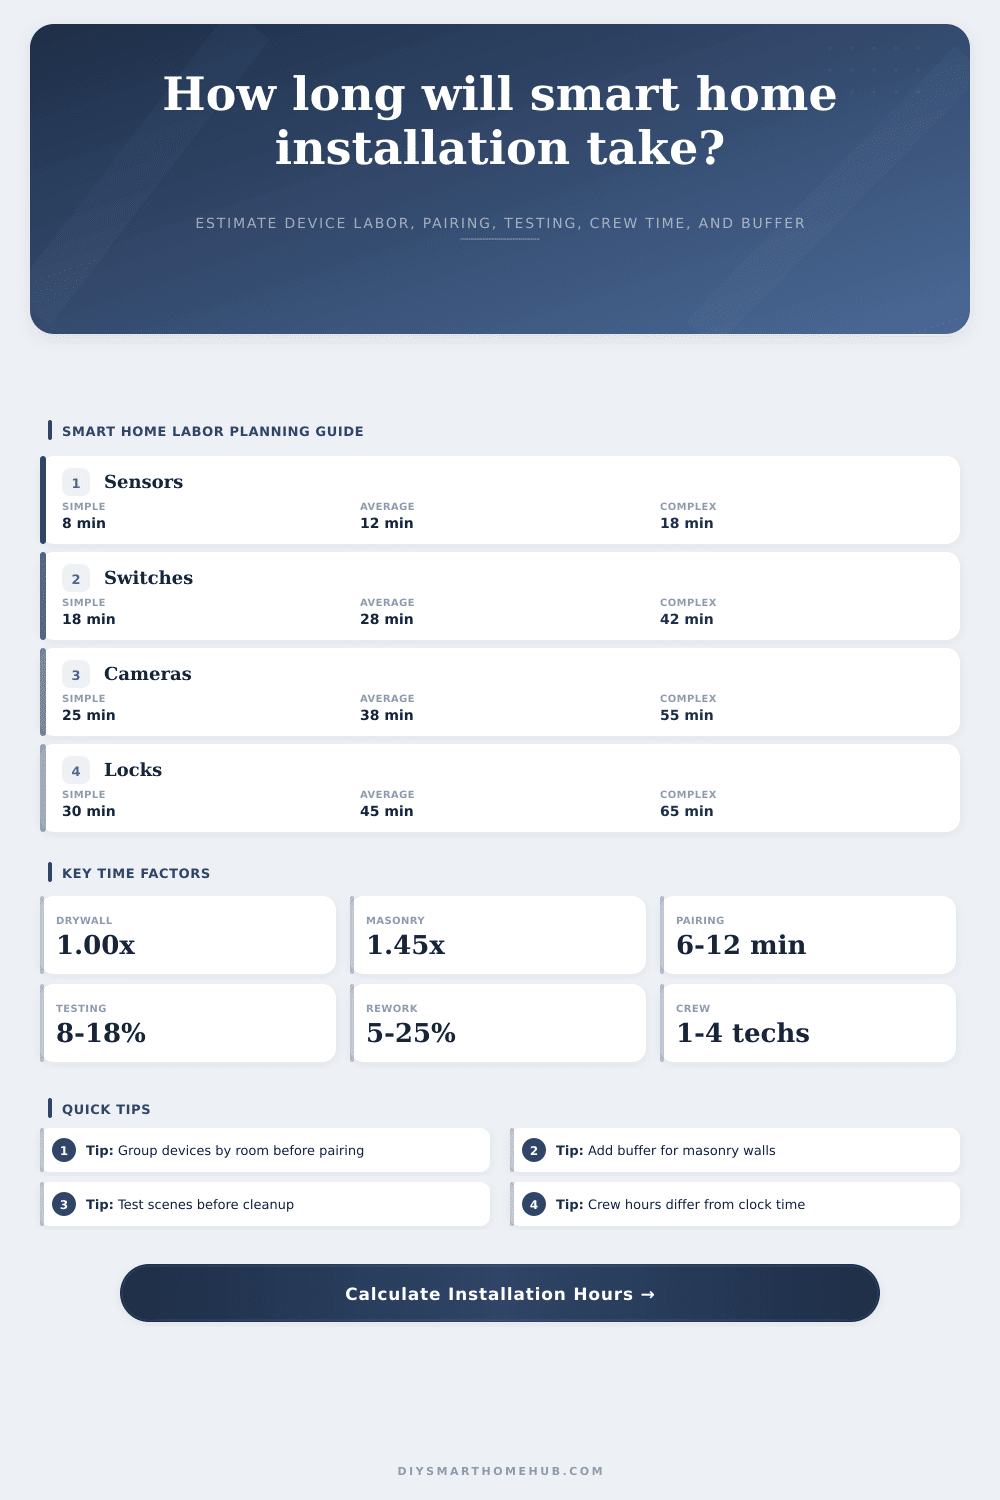
| Contact, leak, motion, plug, button | 8 min | 12 min | 18 min |
| Switch, dimmer, keypad, thermostat | 18 min | 28 min | 42 min |
| Lock, doorbell, camera, ceiling AP | 30 min | 45 min | 65 min |
| Hub, bridge, gateway, controller | 10 min | 18 min | 30 min |
| Condition | Multiplier | Where it matters | Labor effect |
|---|---|---|---|
| Drywall or wood trim | 1.00x | Indoor sensors and switches | Baseline mounting pace |
| Plaster, tile, or mixed walls | 1.15x to 1.30x | Older homes and finished baths | Slower drilling and layout |
| Masonry, brick, concrete, stucco | 1.35x to 1.45x | Exterior cameras and doorbells | Anchors, bits, and dust control |
| Attic, crawlspace, or ladder route | 1.22x to 1.55x | Ceiling APs, cameras, wire paths | Access moves and safety pacing |
| Allowance | Low | Normal | High |
|---|---|---|---|
| App pairing per device | 4 min | 7 min | 14 min |
| Testing percent after install | 8% | 12% | 25% |
| Rework buffer after testing | 5% | 12% | 30% |
| Crew efficiency after first tech | 80% | 85% | 90% |
| Project | Device mix | Site factor | Typical output |
|---|---|---|---|
| Single room starter | 6 simple, 2 standard | drywall | about 2 to 3 labor hours |
| Apartment security | 8 simple, 2 standard, 2 complex | drywall | about half-day solo |
| Exterior camera set | 5 complex | ladder and masonry | often one full labor day |
| Whole house mixed | 20 to 40 devices | mixed access | crew sizing matters most |
You’ve all had that feeling: The initial giddiness wears off after you purchase your shiny new smart home kit, and you quickly discover it’s going to take forever to install. After all, the items themselves is tiny, and the matching apps appear to be easy.
Guess what? More likely than not, you’re wrong. Installing smart devices isn’t about the devices; it’s about the friction in merging digital world with the physical world. The former is easy, drilling holes into walls is pretty easy. The latter is where time gets eaten up.
Why Smart Home Install Takes So Long
Pairing and testing are often underestimated by most homeowner. By separating the digital overhead from mounting, the calculator above reveals this hidden time, and it requires you to consider what kind of wall your dealing with. I know too many folks who’ve forgotten about this until they’re halfway down a brick wall with incorrect drill bit.
Plaster and masonry add a ton of drag, while drywall goes up quick and easy. And there’s more then just gravity working against you: there’s also density and dust. This gets reflected in the tool as a multiplier because bit changes and anchors will eat away at your time. When you’re racing to get something done in time for dinner every little thing matters.
And then there’s access. You can mount a sensor to your livig room wall with no problem at all. You can’t mount an outdoor camera to the side of your second story stucco wall without a ladder, checking safety and having some patience.
That access adds up and it slows you down, which is why access factors are taken into account in the calculator. A device itself may be simple but overhead work slow things down. When you’re fishing wire through your attic or trying not to fall off the step ladder, you aren’t moving fast. Those physical limitations add up. Add five devices that will take a ladder and while each individual device might be simple it all adds up.
And then there’s the software piece. Since pairing scales with the number of devices in your home (it isn’t a fixed cost), you need to take into account all time spent naming every single device, assigning them to rooms and waiting for firmware updates. It’s not something you can skip on the calculator… Hence the minutes per device.
Same goes for testing. How do you know if the camera recorded or if the door lock responded? The tool calculates a percentage here as well so that you don’t walk out the door with half working features.
The other part of the equation is the crew. It’s odd, but increasing your number of techs doesn’t decrease the total hours of labor in a straight line. Two people doesn’t work at double speed because there’s coordination overhead. The beauty of the calculator is its ability to account for this loss of efficiency; it provides a realistic estimate of how many hours vs. People it takes.
Which, ultimately, is better than assuming two techs can complete a project in two hours instead of four person-hours. That difference help avoid scheduling problems and keep projects from bleeding over into the weekend.
You can sanity check your estimates using the reference tables on this page, which show how different types of projects behave. These could be camera-heavy or sensor-heavy. Exterior cameras is slow to mount, but quick to pair. Contact sensors are fast to mount, but tedious to pair. Knowing this tradeoff will help you plan your day.
Maybe spend the morning tackling the heavy mounting work (you’ve got energy!) and the afternoon doing the digital pairing stuff.
And so, how do you plan for a smart home install? It’s both tech and trades. To stay on schedule, you need to factor in app wait times, getting access, and working on walls. That way, the math adds up. You begin to control your install and stop the guess work. It is more than just a smart home, it’s a completed one.