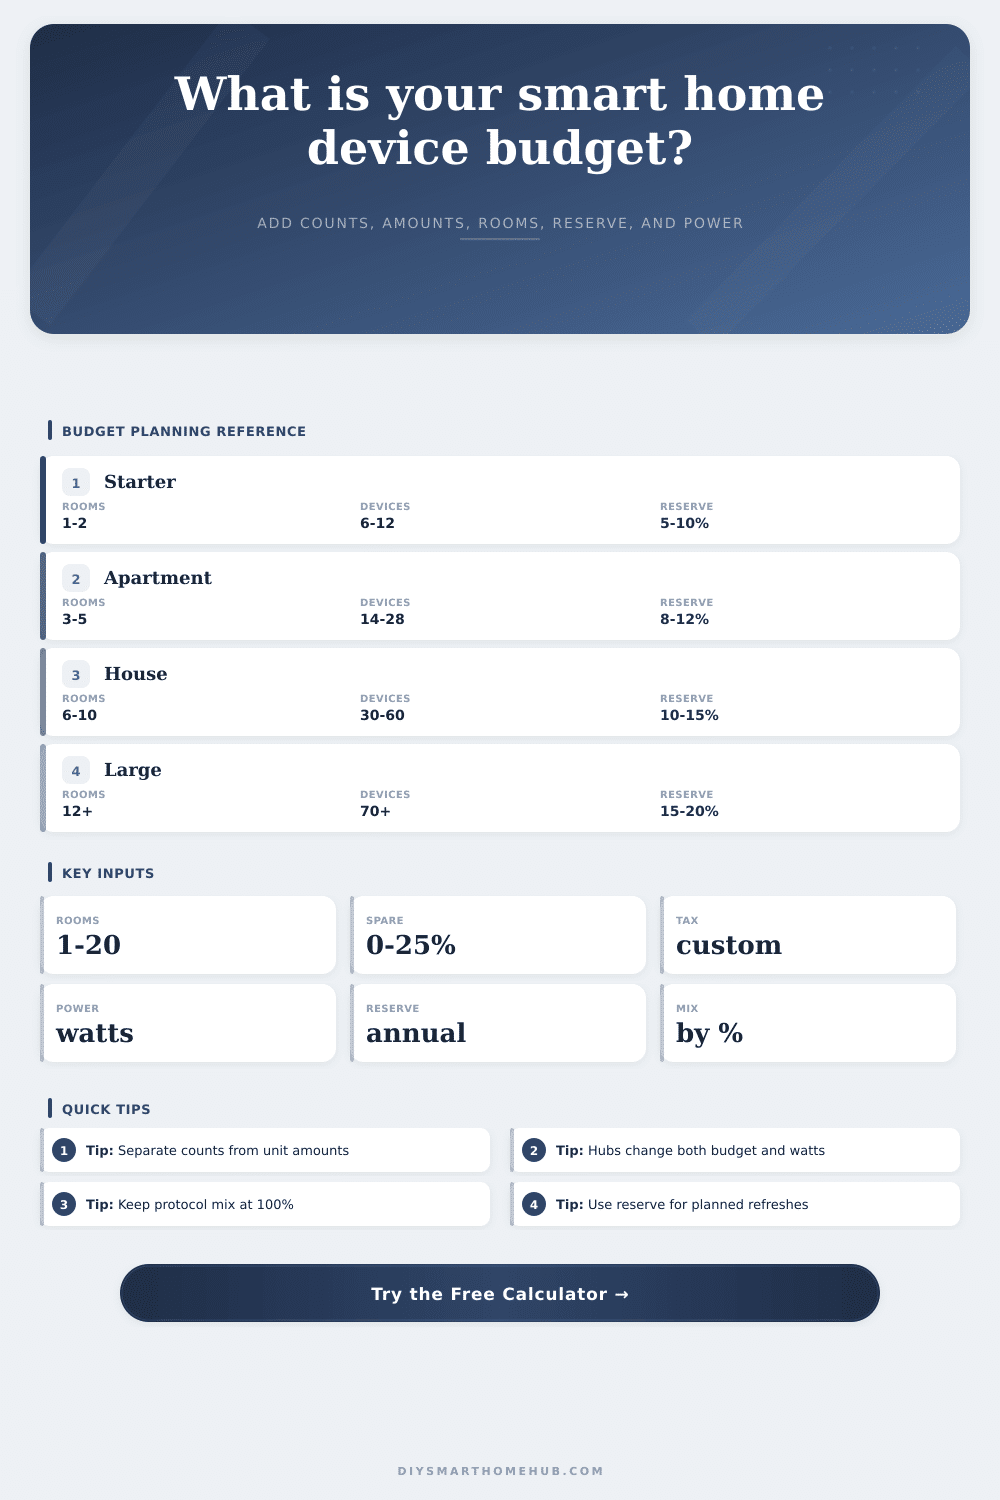
Smart Home Total Device Budget Calculator
Estimate a complete smart-home device budget from your own device counts, unit amounts, rooms, protocol mix, hub needs, spare factor, tax, contingency, power draw, and annual replacement reserve.
| Category | Count source | Unit amount | Formula role |
|---|---|---|---|
| Lighting | Bulbs, switches | User entered | Device subtotal |
| Sensors | Openings, rooms | User entered | Device subtotal |
| Climate | Zones, rooms | User entered | Device subtotal |
| Security | Entries, views | User entered | Device subtotal |
| Control | Panels, remotes | User entered | Device subtotal |
| Hubs | Protocol need | User entered | Bridge subtotal |
| Home scope | Rooms | Typical endpoint band | Pressure note |
|---|---|---|---|
| Single room | 1 to 2 | 4 to 12 | Low hub load |
| Apartment | 3 to 5 | 12 to 30 | Mixed devices |
| Small house | 6 to 9 | 28 to 55 | Room scaling matters |
| Whole house | 10 to 14 | 45 to 90 | Hub planning matters |
| Large property | 15+ | 80+ | Bridge load matters |
| Protocol share | Budget effect | Hub effect | Power note |
|---|---|---|---|
| Thread / Matter | Count based | Border router need | Low to medium |
| Zigbee / Z-Wave | Count based | Coordinator need | Low endpoint draw |
| WiFi | Count based | Router load | Often higher |
| Mixed | Subtotal unchanged | Bridge load split | Use entered watts |
| Field | Applied to | Calculation | Why it matters |
|---|---|---|---|
| Spare factor | Device categories | Subtotal x % | Extra endpoints |
| Tax rate | Device + spare | Base x % | Local total |
| Contingency | After tax base | Base x % | Scope cushion |
| Power impact | Watts x hours | kWh x amount | Annual operation |
| Replacement reserve | Subtotal | Subtotal x % | Annual refresh |
If it’s one smart bulb? You’re still tinkering around. Add a smart plug, a motion detector, and a door sensor. Now you’ve got yourself a system. That’s where most folks’ budget goes off the rails: they go from hobbyist to homeowner, responsible for a network. They snap up the cool-looking stuff then overlook the behind-the-scenes stuff.
These includes the hubs, the bridges, the spare parts, and the little bit of money set aside every year to keep the thing working because something inevitably breaks down or upgrade away. It is not about “what do I spend now?” but about “how much does this thing cost me for the next five years?
How to Plan Your Smart Home Budget
That’s where the calculator does the work for you, after you input the mix of devices and number of rooms, it spits out the answer (above). No need for you to do math around conversions or coefficients. Instead, it makes you step back and consider whole picture rather than price per thermostat based off the sticker.
You begin with what are called your hard costs: the actual numbers for media, security, climate control, sensors and lighting. But here’s where it gets interesting: the inputs for scaling. One thing people often get wrong is thinking that they’ll need only one hub for a hundred devices spread over three floors.
So the tool asks how many devices are WiFi vs. Zigbee vs. Thread, by percentage. Why? Different protocols has different loads on your network. A lot of WiFi endpoints will choke your router. Mesh protocols, such as Zigbee, require coordinator hubs. If you don’t take that into account, your budget will look great on paper, but it won’t work well in reality when your connection drop.
And then there’s the spare factor. That’s the piece everyone misses out on. When you’re wiring up a dozen smart switches, save yourself some trouble and buy an extra (or two). Some will break, others will go missing inside electrical box and still more will be swapped out as you upgrade to latest and greatest standard. Budgeting for 10% of your device subtotal accounts for all this without making it feel like money down the drain. It’s insurance against the trouble of installing stuff.
Next, there’s tax and contingency. These are always-on numbers that add up fast. After the spare factor, the calculator factors them in. This gives you a real cash-out-the-door number that won’t embarrass you at home improvement store. You won’t find yourself $20 short because you forgot to include local tax rates.
There’s also the silent price of power. Even smart devices with “off” use electricity. You can enter average standby watts for each of your hubs and other device. Maybe your hub draws just five watts, but it do so 24/7. That adds up over time. Multiply that by your local energy rate, and that’s your per-year operating cost. If the savings from having those few extra ambient light sensors aren’t worth their standby power cost, then maybe you’ll skip them after all. It makes the choice concrete and financialy.
That is the annual replacement reserve. Home automation isn’t set-and-forget. Devices goes obsolete, batteries expire, firmware gets updated and breaks things. Eight-to-twelve percent of that original subtotal is a sinking fund for those unexpected costs. It keeps budget honest.
How does complexity scale with number of rooms? As you’d expect, a larger property require not only more but different devices, as well as greater contingency buffers and bridges. This approach to planning takes the panic out of growing your smart home.
No more impulse buys, no more buying without considering your system’s capacity. Instead, you’ll buy what you have room for. Because you want a system that’s reliable in the long run, not a system you’re constantly rebooting on Tuesday night.
If you do it up-front, math is simple. Multipliers. Counts. It provides a complete picture of total cost of ownership. It lets the numbers dictate scope while filling in the blanks of devices in each room. It keeps the dream alive without breaking the bank.