Sprinkler Precipitation Rate Calculator
Calculate sprinkler application rate from nozzle flow, spacing, arc, nozzle count, distribution uniformity, and target watering depth for smart irrigation zones.
| Nozzle type | Common spacing | Typical rate | Smart controller use |
|---|---|---|---|
| Fixed spray head | 8 to 15 ft head-to-head | 1.2 to 2.2 in/hr | Short starts; often needs cycle-soak on clay or slopes. |
| Matched precipitation spray | 8 to 15 ft with arc-matched nozzles | 1.3 to 1.8 in/hr | Good for mixed quarter, half, and full heads when nozzles are matched. |
| Gear rotor | 22 to 40 ft head-to-head | 0.35 to 0.75 in/hr | Longer runtime, usually friendlier to soil intake. |
| Rotary nozzle | 13 to 24 ft with matched arcs | 0.35 to 0.80 in/hr | Useful retrofit when spray zones run off too quickly. |
| Strip spray | Side strips and narrow turf | 1.2 to 2.4 in/hr | Check real spacing because narrow area raises rate quickly. |
| Impact head | 25 to 45 ft on larger zones | 0.30 to 0.70 in/hr | Good for larger turf zones when pressure stays stable. |
| Soil profile | Planning intake | Cycle signal | Runtime note |
|---|---|---|---|
| Sand or loamy sand | 0.75 to 1.00 in/hr | Usually accepts rotor and rotary rates | Water may move below shallow roots if target depth is too high. |
| Loam | 0.35 to 0.60 in/hr | Moderate rate limit | Spray zones often need two or more cycles. |
| Clay loam | 0.20 to 0.35 in/hr | Early runoff risk | Split runtime and allow soak gaps between starts. |
| Clay | 0.10 to 0.25 in/hr | Strong runoff risk | Use short cycles, lower precipitation nozzles, or both. |
| Slope or compacted soil | 0.08 to 0.20 in/hr | Runoff before depth target | Start with conservative cycle lengths and confirm with observation. |
| Zone example | Inputs | Calculated rate | Runtime for 0.5 in |
|---|---|---|---|
| 12 ft spray lawn | 1.2 GPM, 12 x 12 ft, 360 deg, DU 75% | 0.80 gross in/hr | About 50 min effective runtime |
| 30 ft rotor lawn | 4.0 GPM, 30 x 30 ft, 360 deg, DU 80% | 0.43 gross in/hr | About 87 min effective runtime |
| 10 ft half spray | 0.85 GPM, 10 x 10 ft, 180 deg, DU 70% | 1.64 gross in/hr | About 26 min effective runtime |
| 18 ft rotary corner | 1.1 GPM, 18 x 18 ft, 270 deg, DU 78% | 0.44 gross in/hr | About 88 min effective runtime |
You could be watering a lot less, and still having a greener lawn than your neighbor. It’s not luck… It’s math instead of guesswork.
Sprinklers are an input/output relationship: Your grass responds to certain inputs, yet most homeowner treat their controller as if it were a switch. You turn it on, wait until it is finished, and then it is done. But misapplying that input can damage the turf or make you waste water.
Why Math Helps You Water Better
After you enter information about arc coverage, the head spacing, and nozzle flow, the calculator does the math for you. You no longer have to guess when making scheduling decisions.
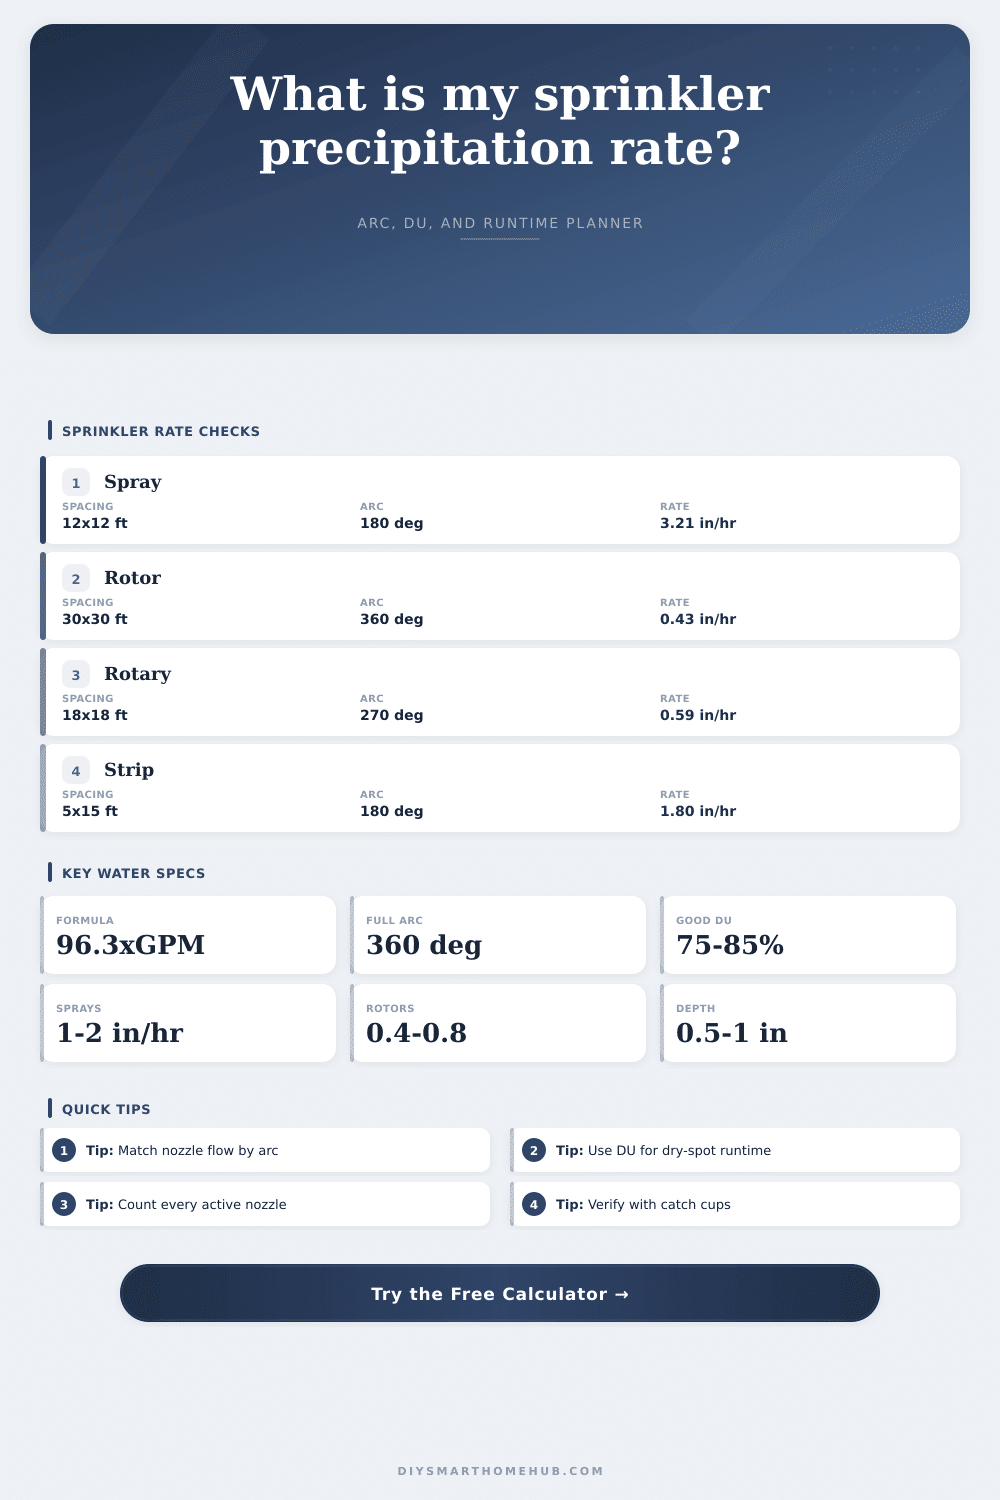
The fundamental part of this equation are the Precipitation Rate (PR). That’s the rate of precipitation falling onto the ground, expressed in inches per hour. Sounds easy but consider that each type of sprinkler head apply water at its own speed. A rotor will apply it at half the rate of a fixed spray head. Run ’em both for half an hour and the rotor will just wet the surface but the spray zone will be swimming.
Unless your rotor and spray is fitted with nozzles specifically matched to one another, don’t put them on the same valve, ever. But even if they were, you’d still have to know actual rate in order to schedule properly.
The distance between nozzle makes a big difference in application rate. Two heads spaced a dozen feet apart don’t do as much coverage than two heads spaced twenty feet apart. More water hits every square foot of turf with closer spacing.
The arc is also important. A full circle head will cover more ground then a half-circle one. And if you put a full-circle-designed nozzle into a corner, and limit its spray to ninety degrees, you’ll be wasting flow and overwatering that corner. That’s why entering the proper arc degree automatically adjust the math.
The hidden variable that screws up most systems is distribution uniformity. Even the best-designed sprinklers don’t spread water across every inch exactly the same. Wind, drop in pressure, poorly designed nozzles… They all causes some parts of a system to get less than other parts. If your system has seventy-five percent uniformity, then twenty-five percent of your zone isn’t getting wet enough. The solution? Run the system for longer to ensure even the driest part reaches its target depth. That’s why runtime output has an adjustment for DU (distribution uniformity). Otherwise, you’re just watering the average, not the dry stuff, which goes brown first.
The speed with which your ground takes up the water depends of the soil type. The slowest to do so are clay soils. When you get more rain than your soil can soak up, you’ll notice that some puddles on top of the ground don’t dissapears until your plants’ roots have had a chance to drink them up. Slopes are particularly problematic because gravity works against water soaking in. On the other hand, sandy soils tend to take up water fast but then move it farther down, beyond range of shallow roots. Ideally, your soil would let the water go in and stay around just long enough to be used by the plants, but not sit around wasting time, either.
Adjusting based off weather is what smart controllers do; however, they rely on good data as their starting point. Telling the controller that your precipitation rate is incorrect will result in an efficient but poor schedule. Spend 10 minutes measuring your spacing, checking your nozzles. Want to make sure what’s coming out of those nozzles is realy uniform? Run a test and use some catch cups. Standard intake rates (to know when to use cycle-and-soak strategies) for various soil types are in the reference tables on the page.
To be consistent, you need to know your actual effective runtime and precipitation rate. Otherwise, you are guessing about whether you gave each section of lawn enough water or if it ran off onto adjacent sections. With this data, you begin to manage your resources with purpose. This kind of control transforms an uneven yard into one that looks…healthy. It looks like your neighbor’s grass.