Standby Vampire Power Cost Calculator
Estimate the idle energy used by always-plugged devices, compare load categories, and model how much a smart plug schedule could remove from daily, monthly, and yearly usage.
| Device or group | Load category | Standby W | Hours/day | Count | Off hrs/day | Schedule? |
|---|---|---|---|---|---|---|
Group identical loads when measured together. |
||||||
Sleep modes can vary widely by setting. |
||||||
Idle display and network wake add load. |
||||||
Kitchen display loads are usually continuous. |
||||||
Use count for repeated adapters. |
||||||
Critical loads often stay powered. |
Calculation breakdown
- Enter standby watts, hours, and counts, then calculate.
| Standby load class | Measured standby watts | At 24 hours per day | Interpretation |
|---|---|---|---|
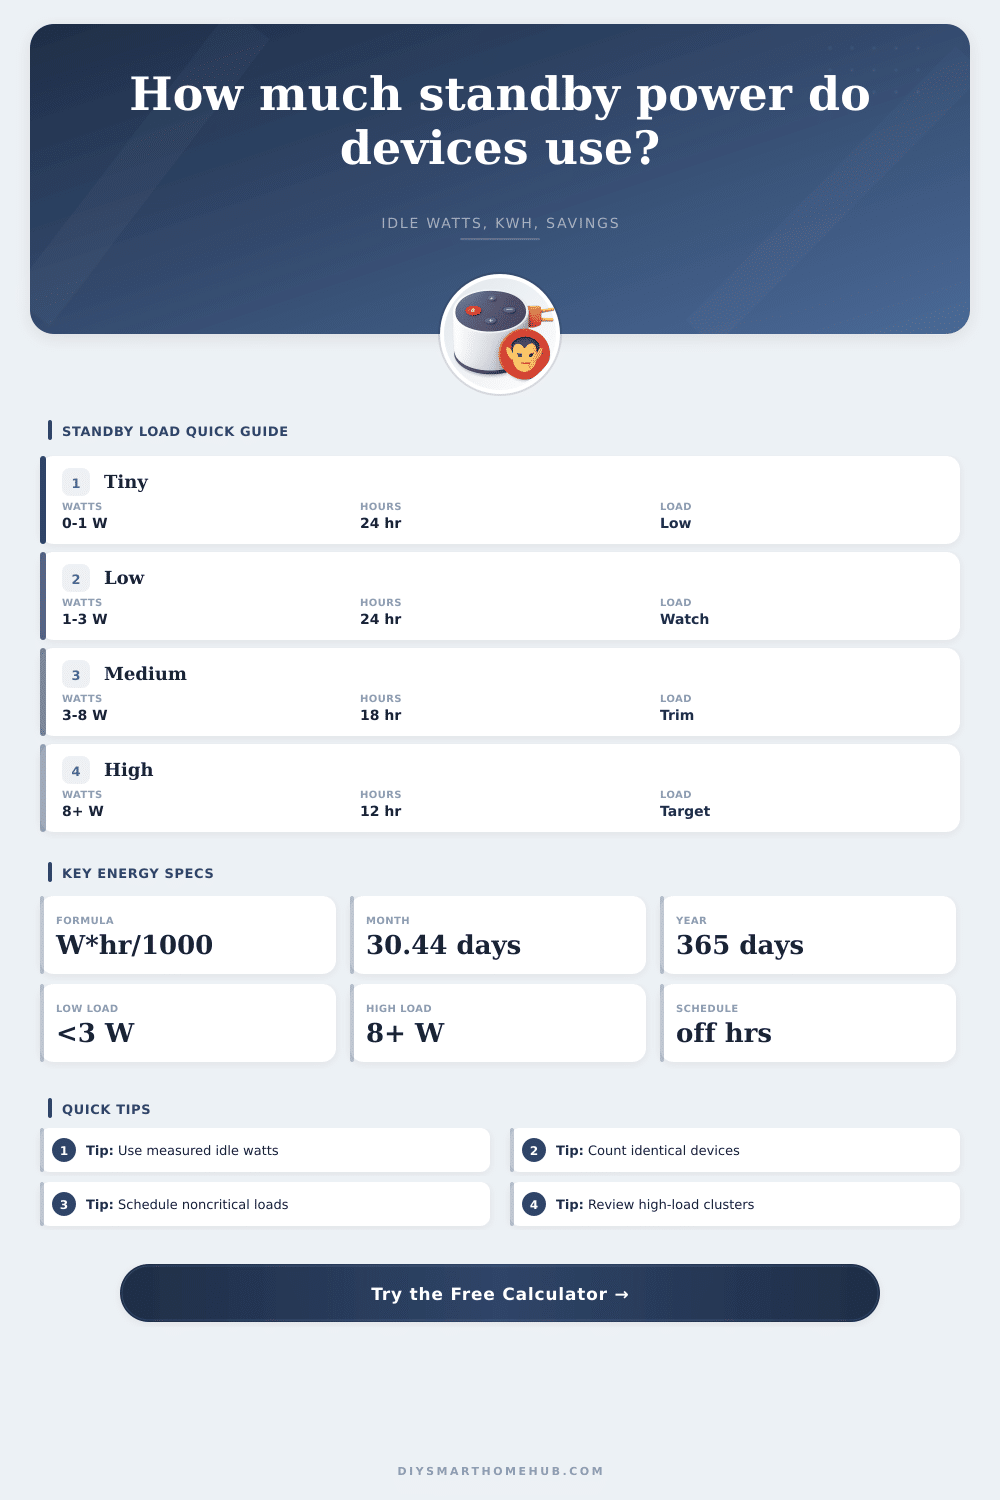
| Tiny phantom load | 0 to 1 W | 0 to 0.024 kWh/day per device | Usually not the first target unless repeated many times. |
| Low standby load | 1 to 3 W | 0.024 to 0.072 kWh/day per device | Worth grouping when several chargers, clocks, or adapters stay on. |
| Medium standby load | 3 to 8 W | 0.072 to 0.192 kWh/day per device | Good schedule candidate when the device is not needed overnight. |
| High standby load | 8 W and above | 0.192 kWh/day and higher per device | Review settings, sleep mode, and whether off-hours are practical. |
| Device group | Typical standby range | Schedule fit | Calculation note |
|---|---|---|---|
| Network gear and hubs | 4 to 20 W per unit or bundle | Often no | Use 24 hours unless you intentionally power it down. |
| TV, audio, streaming gear | 0.5 to 12 W per device | Often yes | Use measured idle draw because quick-start settings change totals. |
| Office printers and docks | 1 to 10 W per device | Often yes | Subtract active work hours if idle mode is only part of the day. |
| Chargers and adapters | 0.05 to 1 W each | Sometimes yes | Count repeated adapters; one is small, many can become visible. |
| Kitchen display loads | 1 to 5 W per appliance | Usually no | Clock and memory loads usually run all day. |
| Safety and monitoring | 1 to 8 W per device | Usually no | Do not schedule off devices that provide alerts or monitoring. |
| Example audit size | Typical device count | Daily standby energy | Best first review |
|---|---|---|---|
| Single media cabinet | 3 to 5 devices | 0.10 to 0.70 kWh/day | Quick-start TV, console sleep mode, audio standby. |
| Home office desk | 3 to 6 devices | 0.08 to 0.45 kWh/day | Printer, monitor, dock, speakers, task lights. |
| Apartment scan | 8 to 16 devices | 0.25 to 1.20 kWh/day | Repeated chargers and entertainment clusters. |
| Whole-home scan | 20 to 40 devices | 0.70 to 3.50 kWh/day | High-W standby rows and always-on groups. |
There is a tiny red LED on your cable box. You don’t even realize it is there until you are fumbling around a darkened livig room, looking for the remote. That device never go into sleep mode when you are not using it. It’s an energy suck… A so-called “energy sink.” And most of us has no idea how much it costs.
When we get our electricity bills each month, most of us assume the majority of our money went to cranking the AC or running the oven. But a big chunk of what we spend dissapears into appliances that is plugged in but not actualy being used. It’s called standby power, and this hidden drain adds up fast. It happen every hour of every day.
How to Save Money on Standby Power
That’s where the idle watts come into play, and the calculator above will do the math for you. In many cases it’s easy to find on manufacturer’s labels: they’re usually marked as “peak” power use, which won’t tell you squat about how much they sucks up when in standby mode. That’s the idle draw, and with a lot of older electronics, that can be considerable.
Resting-mode game consoles may still pull ten watts or more; a nest of phone chargers all left plugged in overnight can add up to a persistent drain. With the tool, you’ll also be able to break these down by number of devices and hours of use, since one watt isn’t anything much, but five across twenty device starts to show up on the books.
But then there’s the bit that most people screw up: when you’re unplugging stuff, how do you know what goes with what? It’s frustrating. People often gets frustrated when they try to unplug everything and forget which cord belongs to which gadget. You can solve this by being strategic instead of pulling things out of wall willy nilly.
Enter the calculator, which allows you to schedule when specific loads go off. For example, maybe your printer is only used a few hours a day. If you turn it off those other eighteen, you’ll save money. On the flip side, don’t schedule all your stuff off. Got a smart lock? How about a router? If you’re working from home, those need to remain powered on.
You must figure out what is essential infrastructure versus what is not, something that just consumes. For example, take the media cabinet in your living room. There’s probably a TV, maybe a soundbar, a streaming stick, and perhaps even a gaming console. At idle, each one use just a few watts of electricity, but together they use as much energy as a small light bulb does in a full day.
In this case, grouping matters. Measuring the combined draw of all those components in standby is far better than trying to guess how much each consumes individually. Those reference tables on the page break them up into tiny, low, medium and high. Anything eight watts or higher qualifies as a high-load item, which will give you largest bang for your buck when it comes to reducing consumption.
Plugging it into a simple smart plug could reduce its load when you leave for work, or at night. But then there are kitchen appliances. Digital displays on coffee makers and microwave clocks stays on all the time. There’s no simple way to turn them off that doesn’t require resetting the time display or reprogramming them in the morning.
To account for this, the calculator let you remove some things from its savings model. That realism will keep your savings estimate from being too rosy. After all, you don’t care about theoretical savings; you only care about real-world ones.
In the end, cutting down standby power isn’t rocket science; it’s awareness. No PhD in electrical engineering required; all you should of do is glance around the house at the constantly plugged-in devices and wonder if they should be. Treat energy that’s standing still like a controllable expense instead of something you can’t change. This way, you reclaim some control over an ongoing and pesky expense.
Next time you grab the remote, think about that little red light. That’s going to cost you more then you think.