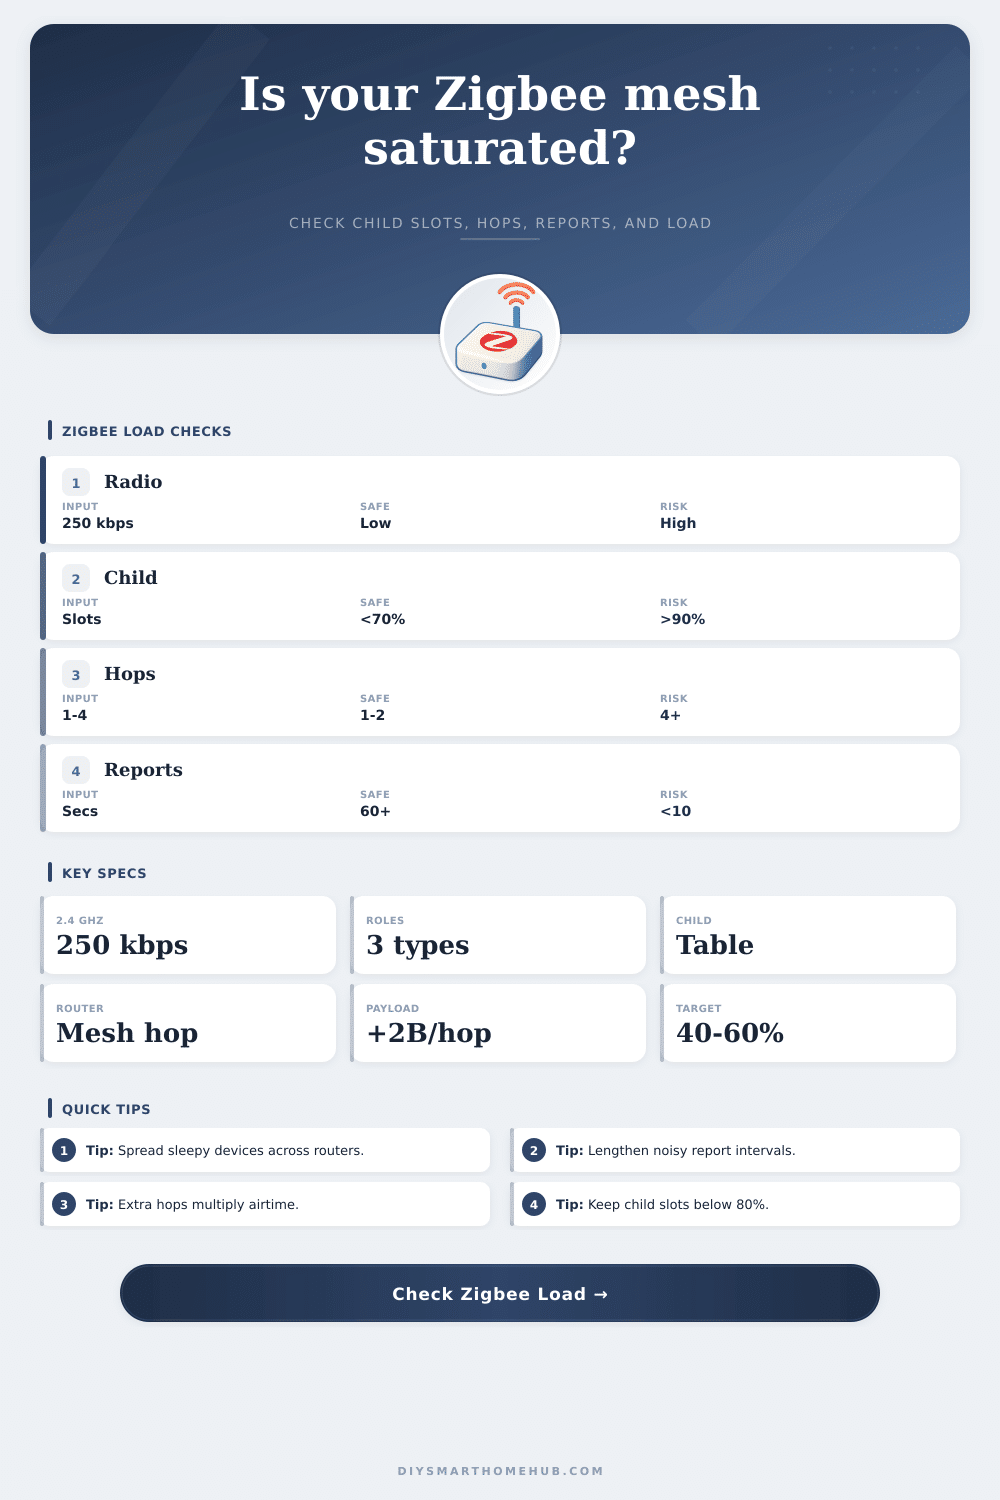
Zigbee Network Device Saturation Calculator
Estimate whether a Zigbee mesh is running out of child table space, neighbor headroom, report traffic capacity, or mesh hop airtime before adding more sensors, plugs, bulbs, and routers.
▣Mesh presetsPick a starting point, then tune the real table limits from your coordinator and routers.
⚙Network inputs2.4 GHz Zigbee uses a 250 kbps raw radio rate; practical safe load is lower.
ℹZigbee spec anchorsCapacity is affected by stack settings and product firmware, not just the standard.
Zigbee rides IEEE 802.15.4; the useful application rate is lower after MAC, security, routing, and retries.
Coordinator forms the network, routers relay traffic, and end devices depend on a parent and can sleep.
Coordinators and routers only accept more sleepy children while their child table still has free entries.
Each intermediate source-route hop can reduce payload room and every hop repeats the RF airtime.
▦Topology comparison gridUse this as a quick sanity check before changing router placement.
▤Report interval load tableExample assumes 60 reporting devices, 30 byte payloads, 2 hops, and typical overhead.
| Average interval | Reports per minute | Mesh behavior | Planning note |
|---|---|---|---|
| 5 seconds | 720 | Very chatty | Use only for short-lived diagnostics or a few devices. |
| 30 seconds | 120 | Moderate to high | Can be workable if hops and retries stay low. |
| 2 minutes | 30 | Typical sensors | Usually comfortable for home automation telemetry. |
| 10 minutes | 6 | Low background | Good for slow temperature, humidity, and battery reports. |
▥Device role referenceZigbee saturation is often about where devices attach, not only how many exist.
| Role | Typical device | Capacity effect | Calculator input to watch |
|---|---|---|---|
| Coordinator | Hub or USB adapter | Starts network and may parent end devices. | Coordinator end-device child slots. |
| Router | Plug, bulb, relay, in-wall module | Relays packets and may add child slots. | Router count, child slots, neighbor entries. |
| End device | Sensor, button, lock, remote | Consumes one parent child slot and may sleep. | Sleepy end devices joined. |
| Reporter | Power meter, climate sensor | Adds recurring traffic load to the mesh. | Reporting devices and report interval. |
▨Saturation thresholdsUse the highest pressure area as the next upgrade target.
| Pressure area | Comfortable | Watch zone | Saturated behavior |
|---|---|---|---|
| Child table slots | Below 70% | 70% to 90% | New sleepy devices may fail to join nearby parents. |
| Neighbor table pressure | Below 60% | 60% to 85% | Routes churn when too many routers compete as neighbors. |
| Safe airtime load | Below 50% | 50% to 85% | Reports lag, retries rise, and commands feel delayed. |
| Average hop count | 1 to 2 hops | 2 to 4 hops | Every packet spends more airtime across the same channel. |
▩Common mesh examplesExamples are planning estimates; use actual firmware table limits when available.
| Network shape | Routers and end devices | Likely bottleneck | Better next move |
|---|---|---|---|
| Small apartment | 4 routers, 28 end devices | Usually airtime is low | Keep report intervals conservative. |
| Sensor-heavy house | 10 routers, 90 end devices | Child tables | Add routers that accept several sleepy children. |
| Bulb-heavy lighting | 45 routers, 20 end devices | Neighbor pressure | Reduce dense router clusters where possible. |
| Power-monitoring mesh | 12 routers, 65 reporters | Report traffic | Slow metering reports and reduce retries. |
✦Practical planning tipsTwo adjustments usually matter most: table headroom and recurring traffic.
Another motion sensor joins your smart home network, but no one’s talking. The light flashes once, and then nothing. For an hour, you wonder: Is this hardware bad? Nope. You purchased a good sensor. Your mesh just had too little airtime (or table space) left, and it stopped working.
This happens because Zigbee scales easily by adding mains-powered routers and battery-powered endpoints without much fuss. But there’s no infinity here. Each hop between devices multiply the strain on the shared channel; each sleeping device take up a memory slot; each packet eats away at radio bandwidth. By modeling these three pressure points simultaneously, the calculator can estimate how much headroom you have in your network, and thus how many more addition you could squeeze in.
Why Your Smart Home Network Gets Slow
Your radios may not be the limiting factor (that’s almost never the case), but number of tables in each coordinator or router is. Because they use limited memory to keep track of their children and their neighbors, there are fewer entries than marketing material advertise. The bulbs/plugs that serve as relays between your battery sensors and mains power also has a hard limit on the number of sleepy end points they’re allowed to parent.
When one of these child tables fill up, no more devices can join. This leaves orphaned sensor searching for another willing parent. That’s a silent failure state: devices aren’t necessarily being rejected, just appearing dead. By spreading your sensors over several router, you avoid bottlenecks in a single point of failure.
The other less tangible constraint is airtime. Smart lights use the same 2.4 GHz Wi-Fi channels as everything else, so they’re competing for airtime with all your internet traffic beyond the physical table. Every time a power meter updates or a thermostat reports its current temperature, it does not just send one transmission. It sends multiple frames that include routing overhead and acknowledgements. These add up fast when you’re sending them every minute from dozens of devices, turning the radio into a congested hallway where packets is waiting in line to get sent.
To model this, the tool factors in the number of hops each packet needs to reach the hub and your typical report interval. Slowing down how often something non-critical updates free up far more airtime than any additional router ever could (and most users forget about that tradeoff). It’s really important to be mindful of the hop count here; each relay in the chain has to repeat the whole signal all over again.
So a straight line from hub to sensor is great, since it only needs to send one update per packet, while three hops to return home would take up three times as much bandwidth on that same update. If you live in an elongated house where there are many intervening walls or distances, then keeping those relay links alive will use up the bandwidth without sending any useful information along the way. That’s what makes certain networks with lots of smart switches feel so laggy: they’re spending a lot of time trying to route packets around, but never actualy giving you a status update!
To plan for saturation is to realize that perfect responsiveness isn’t something you get in a crowded spectrum. To get things working reliable you have to relax the frequency at which devices report when possible, space them out, and find the right mix between convenient and stable. Your humidity reading might be a few seconds late. That’s a cheap tradeoff for an actual system that delivers information.
The tables on the page can help you visualize these thresholds: where your setup crosses from comfortable to risky. In the end, a mesh that stays stable becomes invisible because it doesn’t ask you to troubleshoot it. Give yourself some breathing room up in air (leave it some retries every now and then) and keep those child tables under eighty percent and your network will reward you with years of silence.