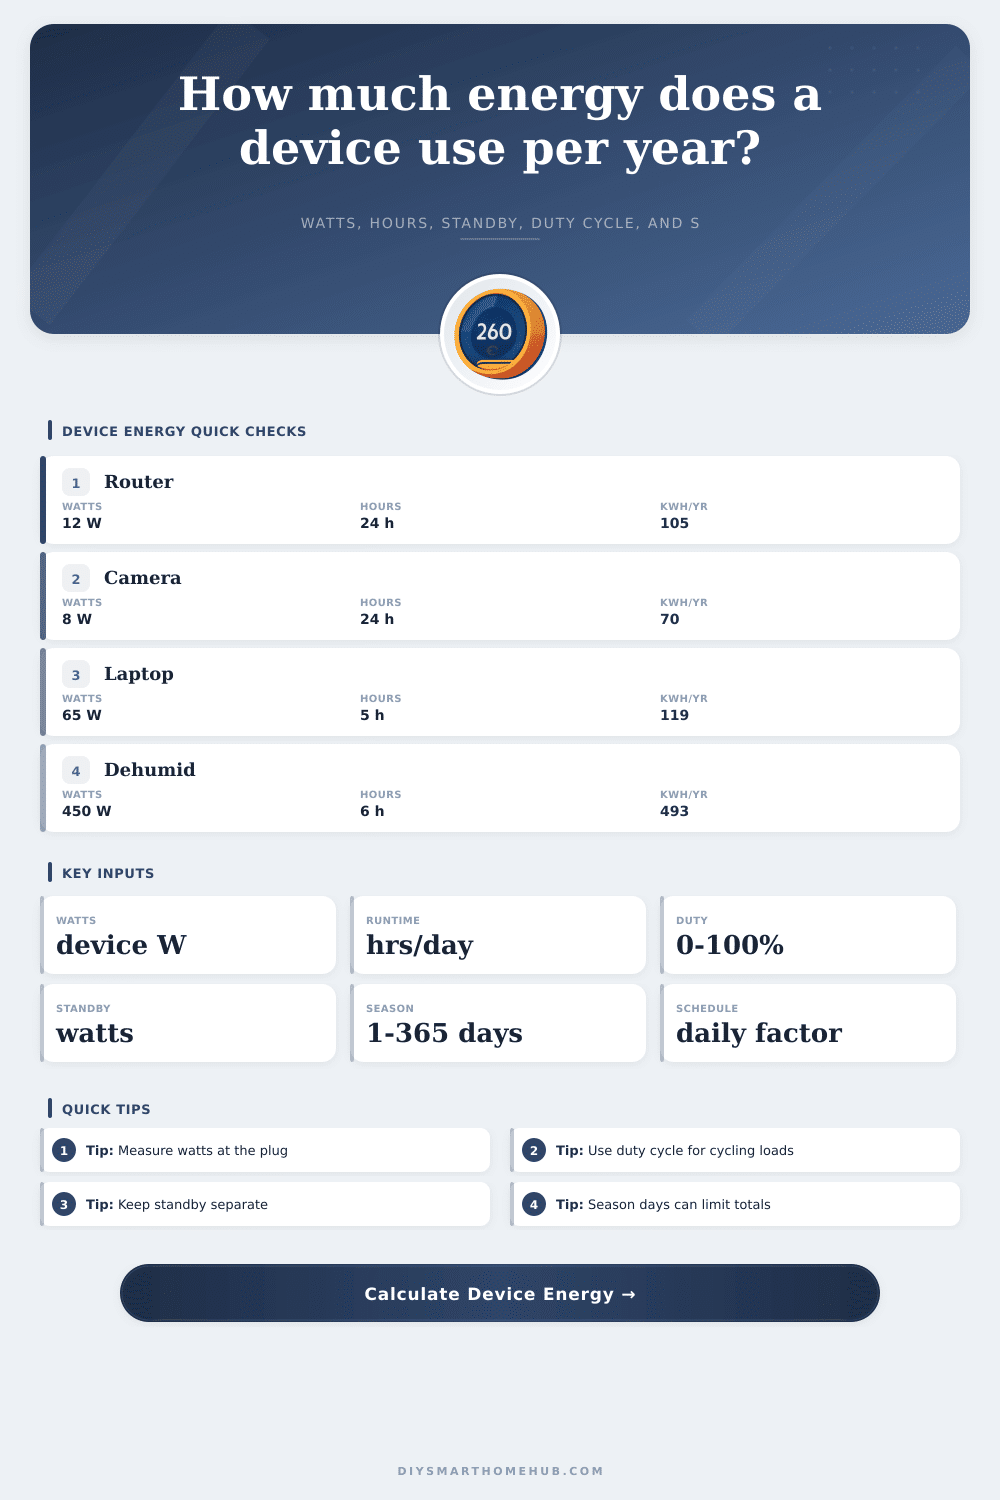
Device Energy Per Year Calculator
Estimate annual energy use from device watts, hours per day, duty cycle, standby draw, seasonal days, quantity, efficiency factor, and operating schedule.
Energy results
| Metric | Formula | What it means |
|---|---|---|
| Run days | Seasonal days × schedule factor | How many days the active schedule runs. |
| Active kWh/year | Watts × hours/day × duty × run days × quantity / 1000 | Energy used while the device is doing its main work. |
| Standby kWh/year | Standby watts × standby hours/day × seasonal days × quantity / 1000 | Energy used when plugged in but not active. |
| Adjusted kWh/year | (Active kWh + standby kWh) / efficiency factor | Accounts for adapter, inverter, or driver losses. |
| Average power | kWh/year × 1000 / 8760 | Continuous watts equivalent across a full year. |
| Device | Typical active watts | Typical schedule | Energy note |
|---|---|---|---|
| WiFi router or mesh node | 8-18 W | 24 hours daily | Usually full duty cycle and no separate standby. |
| PoE security camera | 4-12 W | 24 hours daily | Night IR, heater, and pan-tilt can raise draw. |
| Smart speaker | 2-8 W | Always plugged in | Most energy is low-power idle use. |
| LED strip or cabinet lighting | 6-60 W | 1-8 hours daily | Brightness percentage works like duty cycle. |
| Air purifier | 25-90 W | 4-24 hours daily | Auto mode can be estimated with duty cycle. |
| Dehumidifier | 250-700 W | Seasonal | Compressor cycles, so duty cycle matters. |
| Pattern | Input approach | Example | Best for |
|---|---|---|---|
| Always on | 24 hours, 100% duty, daily schedule | Router, switch, NVR | Network and security equipment. |
| Timed device | Actual timer hours, 100% duty | LED strip, grow light | Loads that stay steady when on. |
| Cycling load | Available hours with 20-70% duty | Dehumidifier, purifier | Thermostat, humidity, and auto modes. |
| Workday use | Weekdays schedule | Dock, monitor, printer | Home office devices. |
| Seasonal use | Limit seasonal days | Fan, heater, humidifier | Devices used part of the year. |
| Annual energy | Average watts | Equivalent example | Planning note |
|---|---|---|---|
| 10 kWh/year | 1.1 W | Small standby load | Easy to miss unless always plugged in. |
| 50 kWh/year | 5.7 W | Small smart device | Quantity can make the total meaningful. |
| 100 kWh/year | 11.4 W | Router-class load | Common for always-on network gear. |
| 500 kWh/year | 57.1 W | Cycling appliance | Runtime, duty cycle, and season dominate. |
| 1000 kWh/year | 114.2 W | Large continuous equivalent | Worth measuring with a plug meter. |
Your electric bill appears as one number, seemingly unchangeable. You know the number come from your meter but somehow feels set in stone. But dig into the number and you’ll find it’s just plain boring. The big load isn’t a single appliance. Hundreds of tiny devices sucks power silently during the night or day when we’re at work. How much does each device cost?
Here’s a calculator that let you input the wattage of each unit and the number of units. You can also enter how long each one runs per day and the season they run in. Finally, you can include how efficient each is and whether it have a stand-by feature (and what that draws). Makes sense why your house sucks up so many watt. And helps you compare smart home loads.
How to Understand Your Electricity Bill
People think of wattage as a fixed number on a box. It’s not. A ten-watt router might draw six watts if it’s idle and twelve watts if there’s traffic spike. That means that nameplate ratings aren’t always so accurate, measured watts is better. For exact measurements, get yourself a plug-in meter. Otherwise, start with the pre-sets for typical devices such as smart speaker and cameras. Make sure you know what you’re measuring in your own setup.
But it’s easy to get tripped up by intuition here. When thinking about how long your laptop is running, you think, “Oh, I only use it while I’m typing.” But it’s drawing current even with a background update or just sitting there docked. Or your dehumidifier goes on and off. Compressor turns on, compressor turns off. Enter duty cycle. Since this thing does half its duty cycle while it’s on, putting down 50% as the duty cycle will be closer to real life than guessing that it’s constantly drawing power. That makes a huge difference in the annual total.
Reducing standby power saves money: People leave things plugged in all the time because unplugging them at the end of the day is annoying. That’s watts going down the drain when a streaming box is idling until its next use or a smart TV are waiting to wake up and obey some voice command. The tool will help separate out the amount of draw while it sits idle vs. When it’s being used. Which may give you pause; maybe a handful of smart plugs drawing two watts apiece adds up to almost ten kilowatt-hours a year sitting there doing nothing… It doesn’t feel like much, but it isn’t.
There’s also a seasonal twist. In summer, there’s no need for a heater running all day. You only use an air purifier in allergy season. Don’t inflate your annual estimate by entering the days of use for a device that naturaly runs sometimes. Set constraints around seasonal days and you’ll limit it to what makes sense. Like in reality, your habits (and climate) determine how long a device is used. Enter your constraints and let the calculator do the math. No need to guess at conversions or coefficients.
The quantity is a multiplier; it will make little issues big. A single security camera isn’t going to be much. A dozen around your property won’t. You can spin up copies of any device with this tool, and that’s important if you’re constructing a smart home or have a network closet filled with a bunch of nodes all running in parallel. Low-power appliances adds up more than an occasional high-power appliance do.
Inverters and adapters lose some efficiency. They don’t convert every bit of electricity that reaches their input into electricity flowing out of them. Electricity will be lost somewhere (and turned into heat) in your power strip, brick adapter etc. You can factor that in to get an idea of how much you’re really paying. It is a tiny detail, but it’s important if you care about accuracy.
That’s what happens when you understand the variables. Instead of some vague worry about the size of your home’s energy footprint, it transforms into a set of separate decisions that you control. Which gadgets are worth leaving plugged in? What could be turned off? It’s not about being perfect, but about knowing. Know the number and do something with it. Break it down by component; break the bill down. Make it understandable again.