Solar Daily Production Calculator
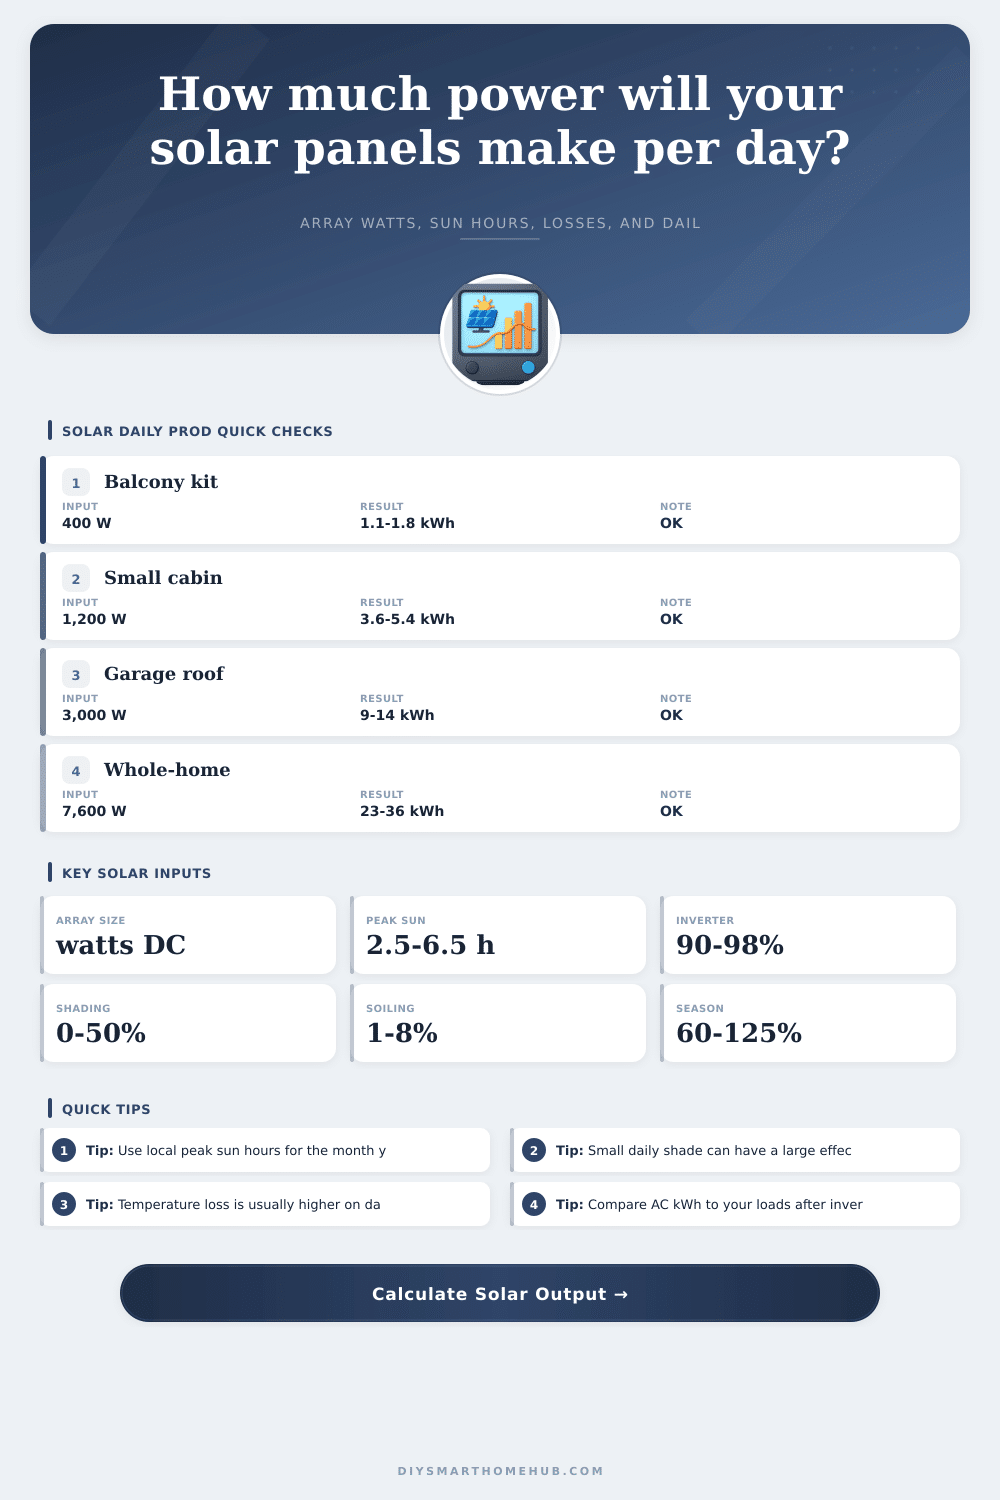
Estimate daily AC solar production from array watts, peak sun hours, tilt and azimuth loss, shading, temperature loss, inverter efficiency, soiling, and seasonal factor.
Fast presets Pick a starting point
PV production inputs DC array to AC kWh
PV spec grid Snapshot from current inputs
Peak sun hour guide
| Condition | Peak sun hours | Planning note |
|---|
Loss factor guide
| Loss | Common range | What changes it |
|---|
Preset comparison table Use as sanity checks
| Preset | Array | Sun | Main losses | Typical use |
|---|
PV sizing reference Daily energy examples
| Daily load | Good sun array | Weak sun array | Battery note | DIY note |
|---|
Production tips
“I’ve got 15 solar panels on my roof,” you say. “I know how much electricity each one produces, and I know how many I have.” So you figure it’s just basic math, right? The problem: Your energy bill isn’t as easy to predict as you think.
Your solar system rely on many unseen factors that reduce output by the hour. Heat builds up beyond ideal conditions. Dust accumulates on surface. Your inverter converts direct current into alternating current, losing some of that energy in the process. Add them up, and these tiny inefficiencies eat away at a good portion of your potential savings.
Why You Produce Less Solar Power Than You Think
So instead of guessing about changes from season to season, the calculator does all this complicated math for you after you enter in your unique limitations. First, you specify how many panels you want in an array, though unless you think about your surroundings, that’s not quite right. For instance, you may think a south-facing roof is perfect, but it rarely is. Tilt and direction losses comes into play, i.e., if your panels are angled southeast or southwest rather then due south, you’ll experience some reduction in peak performance during midday hours when sunlight is highest.
Why should that matter? Because kilowatt-hour totals drive your energy bill; it’s not just those peak minutes that count.
Performance varies greatly with heat. While solar panels responds well to light, they also lose efficiency when temperatures goes above normal testing conditions (STC). The higher the temperature, the lower the voltage, leading to reduced overall efficiency. So even though your panels may put out more per watt on an overcast, cool October day compared to a hot July afternoon when you really want them to perform best, you have to compensate for that thermal penalty without waiting for weather to cool down.
Another big issue is shade. If just one panel of a string is occluded by say a tree branch or chimney, all the panels in that string will be affected because current take the path of least resistance. Optimizers today makes this a bit better but the actual shading will still remove productive surface area from your collection zone.
A little dirt doesn’t sound like much, but it can add up fast. Bird poop, summer dust, spring pollen, all of these things layer onto a surface to form a kind of film that prevents light from reaching those silicon cells. Sometimes, there’s no visible difference between a clean panel and an unclean one, but a clean one will make far more energy then a dirty one. To account for this, the tool has something called soiling loss percentage, taking into consideration how frequently you intend to clean your roof and predicting real world output to match. If you don’t ever intend to climb up and do it yourself, you’ll want to assume the upper range of loss spectrum.
This is where most DIY planners get tripped up, the seasonal variable. They plan their system based off maximum output in the middle of summer and are puzzled when they’re running their generator in January. For solar, we have to size our system for worst case (not the best case). So if you want to count on having juice flowing at 7am in February when it’s snowing outside, you should of build your array so that even with just three hours of skimpy sunlight, there will still be enough power generated. Adjust this variable on the calculator to see how production differs from day to day throughout the year. This helps you get a better sense of how much power you’ll actualy produce over the course of a year versus an overly rosy average.
There’s only one number that pays the bill: how much AC you can use. Having a bunch of DC in a battery won’t get the lights on if it doesn’t make it out of the inverter. That last number after all the losses is what keeps your fridge running and turns on your light at home.
Solar isn’t just about collecting sunshine; it’s about protecting that sunshine from various unavoidable losses until it reaches your outlets. Knowing those losses ahead of mounting the panels often is the difference between a reliable install and one full of frustration.