PMV Thermal Comfort Calculator
Estimate a practical PMV-lite score, PPD dissatisfaction percentage, comfort band, and adjustment suggestions from air temperature, mean radiant temperature, humidity, air speed, clothing insulation, and metabolic activity.
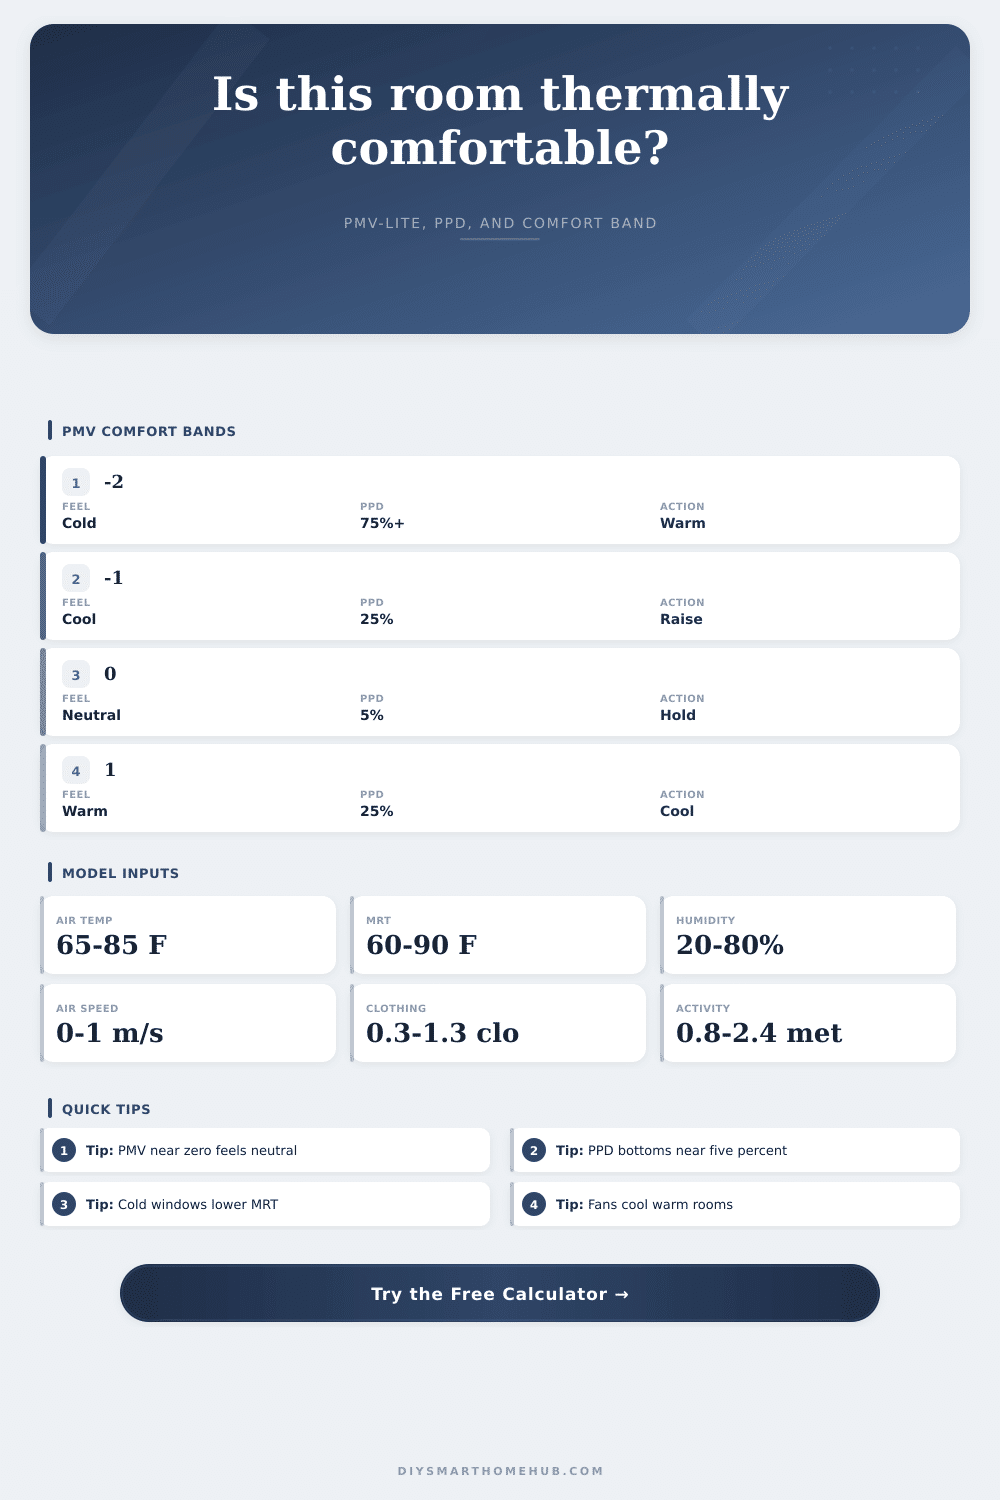
PMV And PPD Comfort Table
| PMV range | Sensation | PPD guide | Interpretation |
|---|---|---|---|
| -3 to -2 | Cold | 75%+ | Major warming adjustment needed |
| -2 to -1 | Cool | 25-75% | Raise air temp, MRT, or clothing |
| -1 to -0.5 | Slightly cool | 10-25% | Near comfort, but many feel cool |
| -0.5 to +0.5 | Comfort zone | 5-10% | Common ASHRAE/ISO PMV target band |
| +0.5 to +1 | Slightly warm | 10-25% | Near comfort, but many feel warm |
| +1 to +2 | Warm | 25-75% | Lower temperature or increase air speed |
| +2 to +3 | Hot | 75%+ | Major cooling adjustment needed |
Input Reference Table
| Input | Typical value | Warmer effect | Cooler effect |
|---|---|---|---|
| Air temperature | 68-78°F | Raise setpoint | Lower setpoint |
| Mean radiant temperature | Within 2°F of air | Sun, warm walls | Cold glass, slab |
| Relative humidity | 30-60% | Higher RH | Lower RH |
| Air speed | 0.05-0.20 m/s | Still air | Fan or draft |
| Clothing insulation | 0.5-1.0 clo | Sweater, socks | Shorts, tee |
| Metabolic rate | 1.0-1.4 met | Resting feels cooler | Activity adds heat |
| Scenario | Air temp | MRT note | Clothing / met | Comfort note |
|---|---|---|---|---|
| Home office | 70-74°F | Near air temp | 0.6-0.8 clo / 1.1 met | Best near neutral PMV |
| Summer living | 74-78°F | Warm surfaces | 0.4-0.6 clo / 1.0 met | Fan speed can help |
| Winter reading | 66-70°F | Cold windows matter | 0.9-1.2 clo / 0.9 met | Radiant asymmetry can dominate |
| Kitchen work | 68-73°F | Appliance radiant gain | 0.5-0.7 clo / 1.8 met | Activity usually warms occupant |
| Sleep setting | 62-68°F | Bedding changes clo | 0.8-1.4 clo / 0.8 met | Target may be slightly cool |
| Workout zone | 62-70°F | Usually neutral | 0.25-0.4 clo / 2.5+ met | High met rate pushes warm |
Have you ever been in a room where thermostat said it was seventy-two degrees but you knew something wasn’t right? Sure, air temperature was comfortable enough, but maybe your legs felt cold or your arms felt prickly. Or perhaps you couldn’t concentrate because something about the space was subtly fighting you.
Chances are that you didn’t feel uncomfortabel for one reason alone. You likely felt a battle between the air temperature, the clothes on your back, the radiant heat from nearby surfaces, and humidity. We blame the thermostat, when in reality the thermostat only tells us half the story. It doesn’t consider the thermal mass of surrounding walls.
How Your Body Feels Comfort
Six factors goes into this number: air temperature, radiant heat, humidity, clothing, metabolic rate and thermal mass/walls. The calculator do all the complicated math to combine these factors into one value (see graph at top). That way, you don’t have to guesstimate what the effect on your comfort is of a leaky door versus a drafty window.
To do this, it employs an adapted form off the “Predicted Mean Vote” (PMV) model, which predicts average thermal sensation of a population within a given space. Its scale goes from negative three (very cold) to positive three (very hot), with zero being thermally neutral. So, the closer to zero, the more comfortable most occupants of that space are likely to be. As you move up or down the scale, unhappiness increase dramatically.
This brings us to the most mysterious part of all, mean radiant temperature. This term describe the average surface temperature of everything around you: the ceiling, the walls, the windows. Your body emits heat to cooler surfaces and absorbs heat from warmer surfaces. This process occur regardless of the air temperature and happens all day long.
Even when the air temperature in your room is warm, a big old single-pane window in the winter might have a low surface temperature. Your body registers this and perceive it as cold. Your body will react accordingly, as if the entire room was cold.
You can enter this value into the calculator; it’s important to get an accurate sense of how much your home contribute to comfort through this method. Without accounting for it, you’re effectively designing for an even-walled box, which doesn’t actualy exist in any real house.
There are two other factors that people frequently forget: metabolic rate (how active you are) and clothing insulation. How hard your body is working determine its metabolic rate; cooking, walking around the house, etc., generate more heat than sitting at your desk. To account for that, the model give each activity a metabolic value.
Clothing also provides extra insulation. Wearing a sweater gives you a lot more insulation compared to wearing a summer t-shirt. Adjusting either of those, your activity or your clothes. Throws off the balance. Your body will be creating heat faster then it can get rid of it. You’ll end up feeling warmer.
This table on the page show all of these inputs and how they combine into a final comfort score.
Beyond that, there’s an aspect of personal sensitivity which traditional models has trouble showing. You can put two individuals with equal input into a room and they will react differently anyway. Some of us are simply built to run warmer or cooler. To account for that biological variation, the tool have a sensitivity setting. It’s a small detail, but it matters when you are trying to optimize a shared space.
It’s really more about knowing what exactly you’re measuring. It’s not just air you’re measuring, it’s the thermal environment. That’s helpful for making smarter adjustments because you can understand those dynamics.
If you’re cold, instead of simply turning up the heat you might shut the blinds (to block out radiant cooling from a window). And if the air’s still, maybe you’ll put on an extra layer. Pulling that lever is the least disruptive thing to do, according to the model.
It’s not about getting it exactly right, it’s about finding that balance point where your body doesn’t need to exert itself to be comfy. Because comfort is this place of equilibrium. When you get there, you don’t think about the temperature anymore. You don’t even notice the room.
It should of been more obvious.