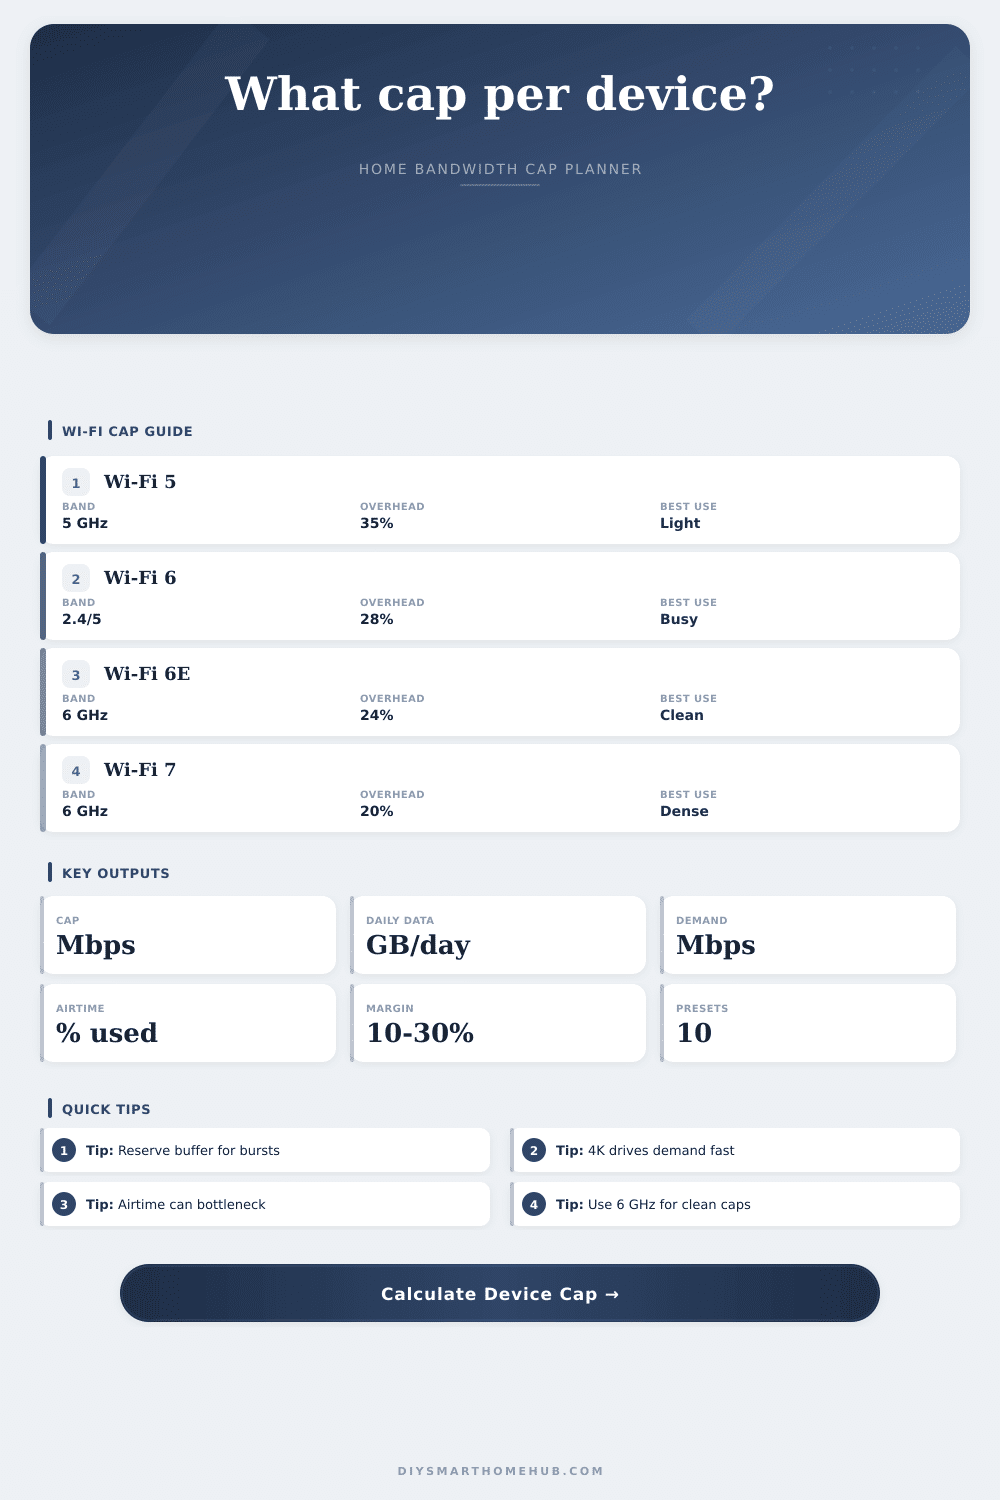
Bandwidth Cap Per Device Calculator
Set a fair Mbps limit for each phone, TV, camera, laptop, or guest device by combining available bandwidth, allocation weight, active device count, streaming demand, Wi-Fi airtime overhead, and buffer margin.
Good for light caps and fewer concurrent high-bitrate devices.
Better efficiency for busy homes, OFDMA-capable clients, and mixed traffic.
Cleaner spectrum helps caps behave predictably with modern clients.
Higher practical headroom for dense rooms and newer 6 GHz devices.
Wi-Fi 5 / 6 / 6E / 7 comparison
| Standard | Planning PHY per stream | Typical overhead | Cap planning note |
|---|---|---|---|
| Wi-Fi 5 / 802.11ac | 433 Mbps at 80 MHz | 30% to 40% | Use conservative caps when many older clients share airtime. |
| Wi-Fi 6 / 802.11ax | 600 Mbps at 80 MHz | 24% to 32% | Better dense-home fairness for phones, tablets, and laptops. |
| Wi-Fi 6E / 6 GHz ax | 600 Mbps at 80 MHz | 20% to 28% | Clean 6 GHz channels make per-device caps more predictable. |
| Wi-Fi 7 / 802.11be | 1441 Mbps at 80 MHz | 18% to 25% | Best planning headroom for very dense rooms and wide channels. |
Streaming and device demand table
| Activity | Down Mbps | Up Mbps | Formula role |
|---|---|---|---|
| Browsing, social, messaging | 2 | 0.5 | Light device count x 2 Mbps. |
| HD streaming | 8 | 0.5 | HD stream count x 8 Mbps. |
| 4K streaming | 25 | 1 | 4K stream count x 25 Mbps. |
| Video calls | 4 | 4 | Calls stress both download and upload. |
| Smart home / IoT | 0.5 | 0.2 | Low bandwidth, but active devices use airtime. |
Preset cap results
| Preset | Devices | Cap/device | Daily data | Status |
|---|
Formula reference
| Formula | Calculation | Input source | Output |
|---|---|---|---|
| Per-device cap | per-device cap = available Mbps*allocation weight / active devices | Bandwidth pool, weight, devices | Raw fair cap |
| Data per day | data per day = Mbps*3600*hours/8/1024 | Recommended cap and hours | GB per device per day |
| Streaming/device demand | Device activity count x Mbps profile | Browsing, HD, 4K, calls, IoT | Total group load |
| Wi-Fi airtime cap | PHY x efficiency x signal x overhead factor x airtime share | Standard, width, signal, overhead | Usable capped-group Wi-Fi |
| Buffer margin | Fair cap x (1 - margin percent) | Margin input | Recommended router cap |
Why do you get buffering? Why does your TV pause, as if your internet service was to slow? It’s not that your internet plan is insufficient; it’s that another device are hogging all the wireless airtime, leaving little for anything else. That’s where bandwidth cap per device calculator comes in. It makes things fair and keeps home network speedy.
With a gigabit connection, you may think all of your devices gets gigabit speeds. That guess fails to account for Wi-Fi. Unlike a pizza, your router doesn’t divide up bandwidth. Instead, it divides up airtime; this works like a walkie-talkie where only one device can talks to your router at a time. If a dozen devices is competing in the same spot, it quickly becomes inefficient.
Why Use a Bandwidth Cap?
The calculator allow you to adjust for signal quality and airtime overhead. Older Wi-Fi 5 hardware will have more overhead penalty then newer Wi-Fi 6 or Wi-Fi 7 hardware. Why is this important? Real-world speed are reduced by the inefficiency of protocols long before you reach your ISP’s data cap.
Setting a cap isn’t about restricting people for the sake of control. It’s about making sure one 4K stream doesn’t starve other streams on your network. In a crowded home, a 4K video feed can require as much as 25 megabits per second. A huge hunk of airtime. If you don’t have a cap, that TV just keeps sending data. Eventually the whole network becomes full, causing lag for everybody else.
You add a 10 to 30 percent buffer margin to allow for bursty traffic as people does big downloads and updates. That margin is your shock absorber, keeping the network stable even if somebody kicks off a heavy background task.
To illustrate how those caps will affect you, it lists what types of device and hours per day you input. It lets you see how fast your devices reach their data limit if you cap them to low. Setting the cap to low may result in being disconnected or getting slowed down by some routers. Or, if you’re too generous with your cap, you won’t get any benefit from having a cap at all because even if your devices don’t go over, the network will still choke during peak times.
The reference tables also illustrate how much bandwidth various activities typically use, and browsing social media uses next to nothing compared to something like video conferencing. That gives you some context as to whether this should of be a device with a tight leash or a generous allowance. Smart home sensors requires almost no bandwidth, for instance, but they do contribute to contention for airtime because they constantly attempt to connect.
Next, take into account what band your devices are on. For example, 2.4 gigahertz has less throughput than 5 and 6 gigahertz, and it’s subject to a lot of interference both from other household appliances and from your neighbors’ networks. So 5 and 6 gigahertz tend to have cleaner channels with faster speeds (though less range). Strict per-device caps can be applied to those bands if you’re willing to split off high-bandwidth devices such as streaming boxes and gaming consoles to their own 5 or 6 gigahertz network where the caps is more predictable.
The calculator allows you to set the channel width and Wi-Fi standard, it will adjust the theoretical maxes accordingly before taking physical obstacles and signal loss into account. It’s an iterative process, and finding the right cap is something that doesn’t have to be done perfectly on your first attempt. Set the values, see what happens during a busy evening, and make adjustments to match.
You want to create a balance where no device take over the conversation; everybody has their fair shot to talk. It makes what would otherwise be a chaotic wireless environment manageable, and it allows for smooth video when you hit ‘play’. You should of checked the signal strength first.