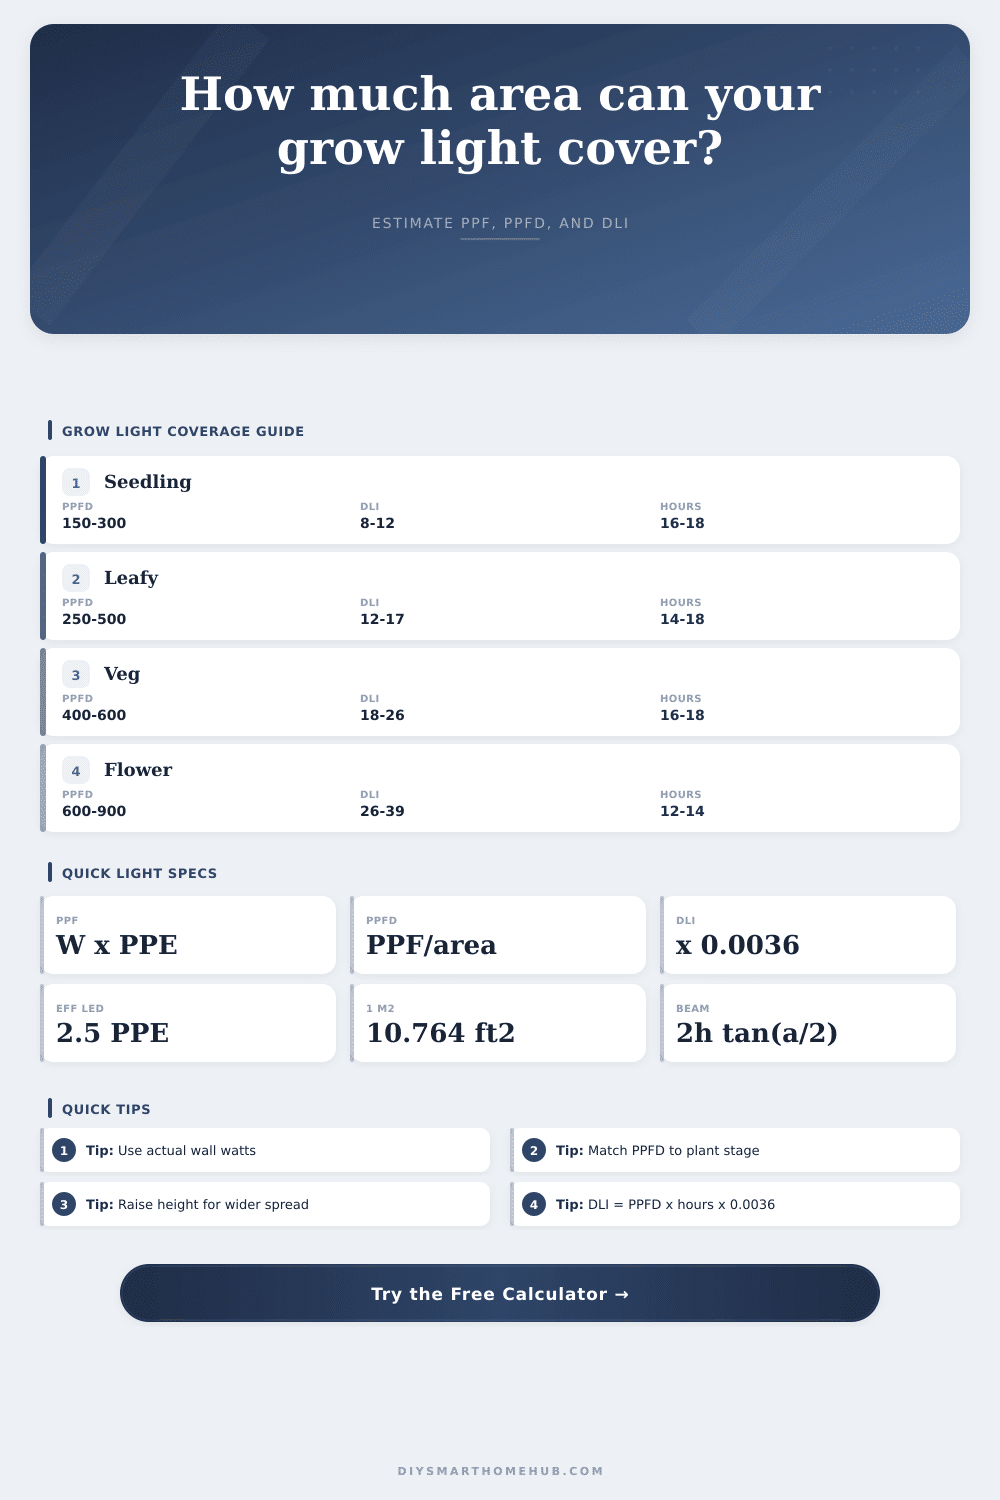
Grow Light Coverage by Wattage Calculator
Estimate PPF from actual LED watts and PPE, average PPFD from PPF divided by canopy area, practical coverage at a target PPFD, mounting-height spread, and DLI from photoperiod.
| Plant stage | Typical PPFD range | Common photoperiod | DLI range |
|---|---|---|---|
| Seedling or propagation | 150 to 300 micromol/m²/s | 16 to 18 hours | 8.6 to 19.4 mol/m²/day |
| Microgreens | 200 to 350 micromol/m²/s | 12 to 18 hours | 8.6 to 22.7 mol/m²/day |
| Leafy greens and herbs | 250 to 500 micromol/m²/s | 14 to 18 hours | 12.6 to 32.4 mol/m²/day |
| Vegetative growth | 400 to 600 micromol/m²/s | 16 to 18 hours | 23.0 to 38.9 mol/m²/day |
| Flowering or fruiting | 600 to 900 micromol/m²/s | 12 to 14 hours | 25.9 to 45.4 mol/m²/day |
| High-light canopy | 900 to 1,100 micromol/m²/s | 12 hours | 38.9 to 47.5 mol/m²/day |
| Fixture profile | PPE estimate | PPF per 100 W | Coverage at 500 PPFD |
|---|---|---|---|
| Older blurple LED | 1.6 micromol/J | 160 micromol/s | 3.4 sq ft |
| Budget white LED | 1.9 micromol/J | 190 micromol/s | 4.1 sq ft |
| Mid-efficiency board | 2.2 micromol/J | 220 micromol/s | 4.7 sq ft |
| Modern full-spectrum LED | 2.5 micromol/J | 250 micromol/s | 5.4 sq ft |
| High-efficacy bar fixture | 2.8 micromol/J | 280 micromol/s | 6.0 sq ft |
| Top-bin horticulture LED | 3.0 micromol/J | 300 micromol/s | 6.5 sq ft |
| Actual watts | Estimated PPF | Coverage at 300 PPFD | Coverage at 750 PPFD |
|---|---|---|---|
| 50 W shelf light | 125 micromol/s | 4.5 sq ft | 1.8 sq ft |
| 100 W compact panel | 250 micromol/s | 9.0 sq ft | 3.6 sq ft |
| 200 W tent panel | 500 micromol/s | 17.9 sq ft | 7.2 sq ft |
| 300 W bar fixture | 750 micromol/s | 26.9 sq ft | 10.8 sq ft |
| 480 W 4 x 4 class LED | 1,200 micromol/s | 43.1 sq ft | 17.2 sq ft |
| 650 W large fixture | 1,625 micromol/s | 58.3 sq ft | 23.3 sq ft |
| Height above canopy | 90 degree spread diameter | 110 degree spread diameter | 130 degree spread diameter |
|---|---|---|---|
| 12 in | 24.0 in | 34.3 in | 51.5 in |
| 18 in | 36.0 in | 51.4 in | 77.2 in |
| 24 in | 48.0 in | 68.6 in | 102.9 in |
| 30 in | 60.0 in | 85.7 in | 128.7 in |
| Step | Formula | Input units | Output |
|---|---|---|---|
| Photon output | PPF = watts x PPE | W and micromol/J | micromol/s |
| Average intensity | PPFD = PPF / area | PPF and m² | micromol/m²/s |
| Coverage area | Area = usable PPF / target PPFD | micromol/s and PPFD | m² and sq ft |
| LED watts required | Watts = target PPF / PPE | PPF target and PPE | actual watts |
| Mounting spread | diameter = 2h x tan(angle/2) | height and beam angle | diameter and area |
| DLI | DLI = PPFD x hours x 0.0036 | PPFD and hours | mol/m²/day |
You dropped two hundred bucks on a grow light that covers four feet. Your tent is three by five. Logically, it should be fine. But according to biology, it’s all up to photons and one key metric for them are invisible. The secret to having a healthy plant or a long, stretched-out crybaby often boils down to an intangible metric called photon density.
Wattage is a trap; it measure how much electricity your fixture consumes, not how many photosynthetically active photons it delivers to your plants. It’s time to stop worrying about watts and start considering coverage in terms of the actual space you’re covering with them. If you know the efficacy rating on your lights and your actual wall draw, then the calculator above will do the math for you. It removes the marketing jive about that vague “equivalent” thing, where a dim 60 watt bulb gets called a blazing 200-watt LED. People don’t understand that’s what they’re buying and instead just fall for a label.
Why Watts Do Not Show True Light Strength
By forcing you to input real watts and photon efficacy, the tool makes you face up to the fact that these two figures multiplied together equal Photosynthetic Photon Flux. It’s the raw horsepower of light being put out by your lamp and if you ignore this number, well, you’re guessing how much light there actualy is to fuel photosynthesis.
But how do you know what’s right? Well, if you’ve got that total output number, then just divide it by your canopy area and voila: average intensity. Here’s where biology meets geometry. A fixture hung at an appropriate distance will concentrate the exact same number of light particles into a smaller footprint. What does that mean? Lowering the fixture increase the overall intensity. It also concentrates the same number of photons into a smaller area, so your plants will be closer to them. The calculator accounts for both beam angle and mounting height and estimates this area, thus providing a general sense of whether or not physical set-up is meeting plant’s biological requirements.
The bottom line: it’s simple geometry, one of many ways in which physics catches out new growers who think farther is better then. Seedlings are tender creatures with delicate appetites; these requirements also change dramaticly as a plant matures. A tomato fruiting (or a canna cannabis flowering) is a glutton… It needs all it can get to add bulk and form. This changes completely throughout the life of any plant. The table of references on the page spells it out: PPFD demands change radically according to growth stage. Don’t set your lights at the same level for a tender clone that you would for a thick, flowering canopy, and don’t stint when the going’s good! Match lighting strength to the growth stage and avoid stressing the plants while wasting their potential output. Feed them on a schedule but adjust based off their appetite.
All that comes together in Daily Light Integral, which combines length and intensity. A longer-duration but lower-intensity light can deliver as much energy during any given day as a higher-intensity one of shorter duration (assuming the plant can tolerate that long photoperiod). That’s the trade-off where efficiency becomes most important. You don’t want to draw too much power or run lights constantly to get enough daily energy to meet your target DLI value, which high-efficiency LEDs enables. The tool figures out this integral for you and lets you know how well your existing setup meets your crops’ DLI needs. If not, there’s nothing you can do by adjusting height (you just have to give them more photons).
Formulas don’t account for real world complexities. Darker fabric absorbs light, which casts shadows and reduces efficiency. Reflective fabric bounces stray light back into the leaf, increasing efficiency more than a formula suggests. Moving air pushes the canopy around to alter penetration of an interior layer of leaves. And a thick canopy casts shade on itself below, making surface level intensity numbers slightly rosy. Use it as a starting place; observe to get the rest. Plants that appear stretched out and wan? They’re hungry. Get that right, however, and it becomes a science, not a guessing game. Instead of buying lights out of fear, you’re creating environments with knowledge in mind. Wattage is the cost of admission, intensity and coverage are what really win the game. Measure twice, adjust once, then check your math with your eyes.