Network Bandwidth Per Device Calculator
Estimate download, upload, Wi-Fi bottleneck, and per-device Mbps for smart homes with streaming, video calls, gaming, security cameras, IoT sensors, and background traffic.
📶Smart Home Bandwidth Presets
⚙Plan, Wi-Fi, And Device Inputs
Network bandwidth estimate
Calculation breakdown
📊Network Spec Grid
💻Device Bandwidth Reference
| Device or activity | Download Mbps | Upload Mbps | Calculator behavior |
|---|
| Wi-Fi type | PHY basis | Usable factor | Range planning note |
|---|
| Signal condition | Range example | Throughput factor | Best planning use |
|---|---|---|---|
| Excellent | Same room or clear line of sight | 100% | Near access point, high-rate 5 GHz or 6 GHz devices. |
| Good | One wall or nearby room | 75% | Typical living room and office devices. |
| Fair | Several walls or edge room | 50% | Bedrooms, corners, and mixed materials. |
| Weak | Garage, outdoor edge, or far room | 30% | Use conservative bandwidth or add a closer access point. |
| Home scenario | Typical active load | Suggested download | Upload warning sign |
|---|---|---|---|
| Small apartment | 1 stream, calls, light IoT | 100-200 Mbps | Calls stutter during photo backup. |
| Family streaming | Multiple HD/4K streams | 300-500 Mbps | Cloud cameras compete with calls. |
| Camera-heavy smart home | 6-12 upload-heavy cameras | 300-500 Mbps | Upload plan is often the first limit. |
| Power user home | 4K, gaming, calls, backups | 500-1000 Mbps | Backup devices saturate uplink. |
| Large mesh home | Many rooms and edge devices | 500-1000 Mbps | Wireless backhaul reduces real Wi-Fi capacity. |
🧭Bandwidth Planning Tips
It begins with something that sounds like a huge internet deal: five hundred megabits of downloading goodness! But once everyone starts using their devices at once, thing can start to struggle. Fast-forward to Friday night. Someone starts a video call. Two tablets is buffering 4K streams. Three security cameras wants to send up high-res motion clips all at once. Your phone falls out of a FaceTime call right when you’re about to say goodbye to someone.
Did the network break? No, no. It’s full. You can’t scale bandwidth infinitely by plugging more devices into the wall. That’s not how it works. It’s a shared pipe, and all those things sip differently than of it. Knowing exactly what each one consumes change everything.
Why Your Internet Feels Slow
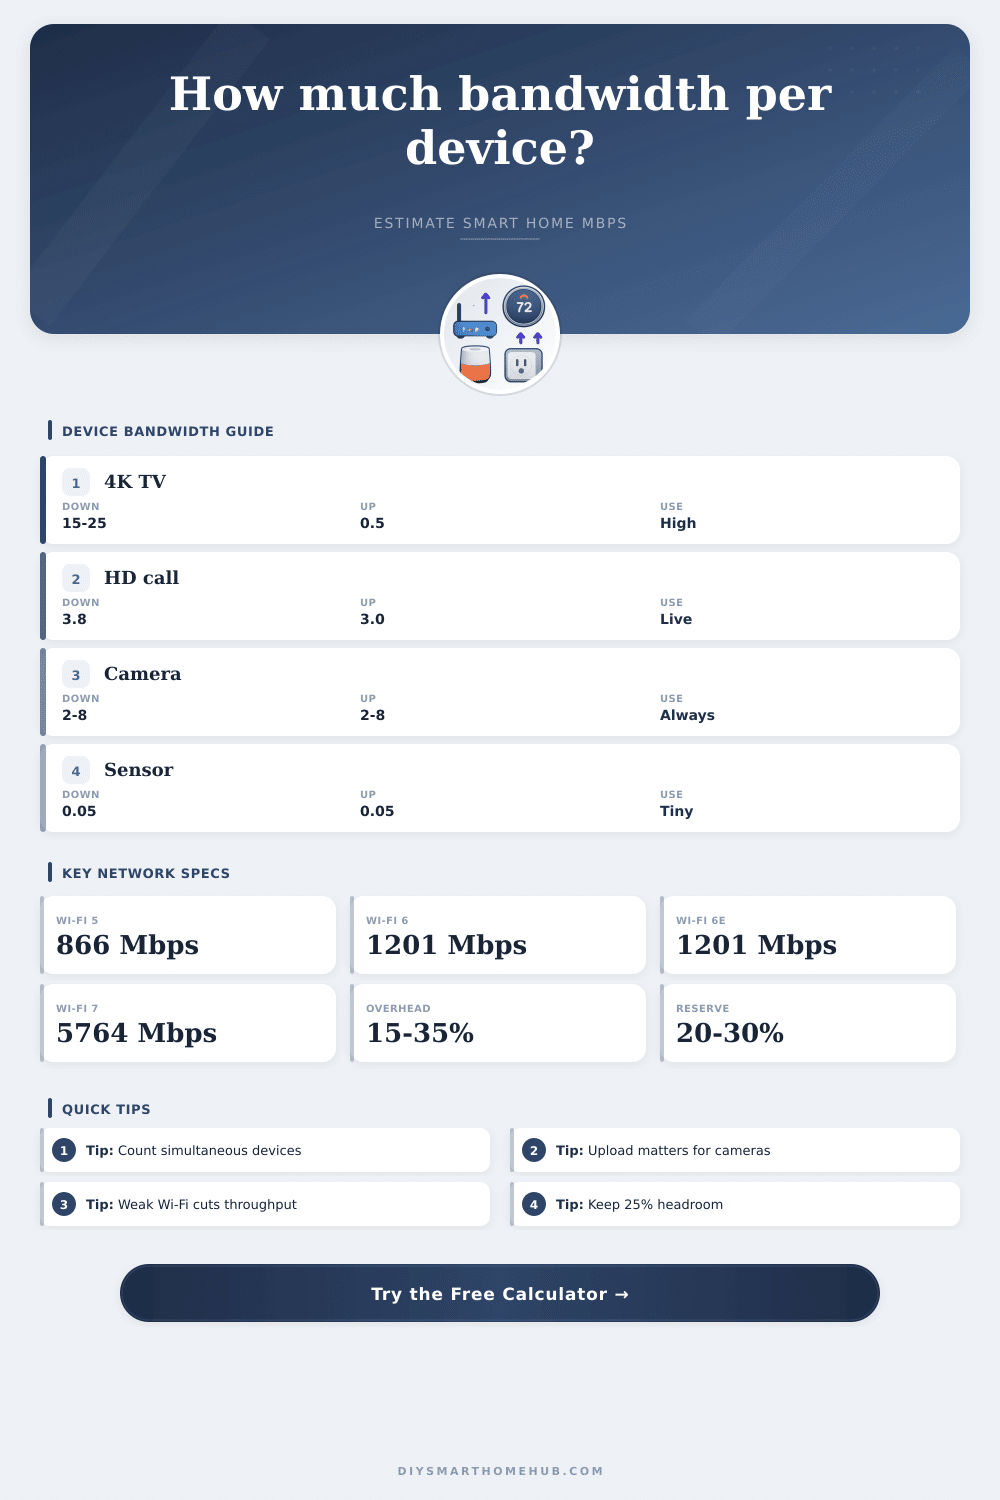
After entering your personal household blend into the calculator (above), the rest of the work is done for you, no more guessing at conversions or coefficients. You’ll still want to know how that input works, however, since most of us assume that all data traffic are created equally. It’s not. A smart thermostat sends just a few bytes every few minutes; hardly worth noticing. A 4k television use about twenty-five megabits per second when playing, all day long. Two of these suck down half a typical gigabit connection by themselves. Knowing what’s realy being used in your living room is mostly the key here.
The quiet killer today for many home network is upload speed. Download capacity gets all the airtime. But video conferencing and cameras does it backwards: they shove data up. One high-def security camera continually pushing content to the cloud will consume three to five megs of upload bandwidth at all times. Add a Zoom call that needs steady upload to keep video quality high, and you’ll quickly see why your “symmetrical” fiber plan was worth the money. You might also see why your cable internet’s upload is struggling even if your download isn’t full yet.
There’s also the added wrinkle of Wi-Fi performance that raw speed tests tend to overlook. The box on your router lists a theoretical maximum under ideal conditions. Those never occur in a brick house. Signal gets absorbed by walls. Speed drops with distance. The calculator compensates for all that, allowing you to choose the Wi-Fi standard and signal quality, converting those abstractions into something useful: shared capacity.
Depending on where in your house the router is located, even if you have a super-fast ISP connection, you may only be seeing thirty percent of what it advertises if you’re on the fringes of its reach. And that’s the thing everyone gets wrong. When they don’t get the speed they expect, they blame the internet provider rather then their own management of airtime.
There are penalties for using mesh networked routers (if they use wireless backhaul). Each node in your network eat up some of the bandwidth that your real world devices need to play with. By keeping pipes wired back to the router, those lanes remain clear. Splitting up the pie for all those nodes mean less for what’s important to you. Again, a small detail, but it matters when you’re trying to game, call someone on video, etc. The tool accounts for this extra work and lets you see what sort of real-world impact your hardware decision will have.
The last variable is concurrent usage. If you’ve got 50 devices hooked up to your router, it doesn’t mean they’re all actively using bandwidth at any given moment. When you flip a switch, your smart bulb starts talking. Then there’s your laptop sitting idle while it waits for an update. A concurrency factor estimates how many of those devices is actually demanding your bandwidth simultaneously. It helps people focus less on their number of connection and more on load.
Because network traffic is like traffic, it’s best to plan for some headroom. The small bit of breathing room helps smooth out those surges when everyone suddenly decides to download/stream at once. Without a cushion, you’ll get lots of spikes in latency (the time between hitting “send” and hearing your friend’s ring), and your connection will got all jacked up.
Don’t need infinite speed? Sure. Need enough for Friday night’s rush? Absolutely. It’ll stop the frustration. It would of also help you understand why your phone drops calls right as you’re saying goodbye.