Vampire Power Calculator
Estimate standby energy, active energy, average watts, annual kWh, and the kWh reduced by a smart plug cutoff for always-idle electronics and chargers.
🔌Standby Load Presets
⚙Device Energy Inputs
Vampire power estimate
Calculation breakdown
📊Device Standby Spec Grid
📋Reference Tables
| Formula | Equation | What it means | Input source |
|---|---|---|---|
| Daily standby Wh | Standby W x count x standby hours | Baseline idle energy before cutoff | Meter reading or nameplate estimate |
| Daily active Wh | Active W x count x active hours x duty cycle | Energy used while the devices are actually doing work | Measured active draw or realistic average |
| Annual energy | (Active Wh + standby Wh after cutoff) x days / 1000 | Total kWh for the selected year or season | Calculator result |
| Average watts | Daily Wh after cutoff / 24 | Equivalent steady load across the whole day | Calculator result |
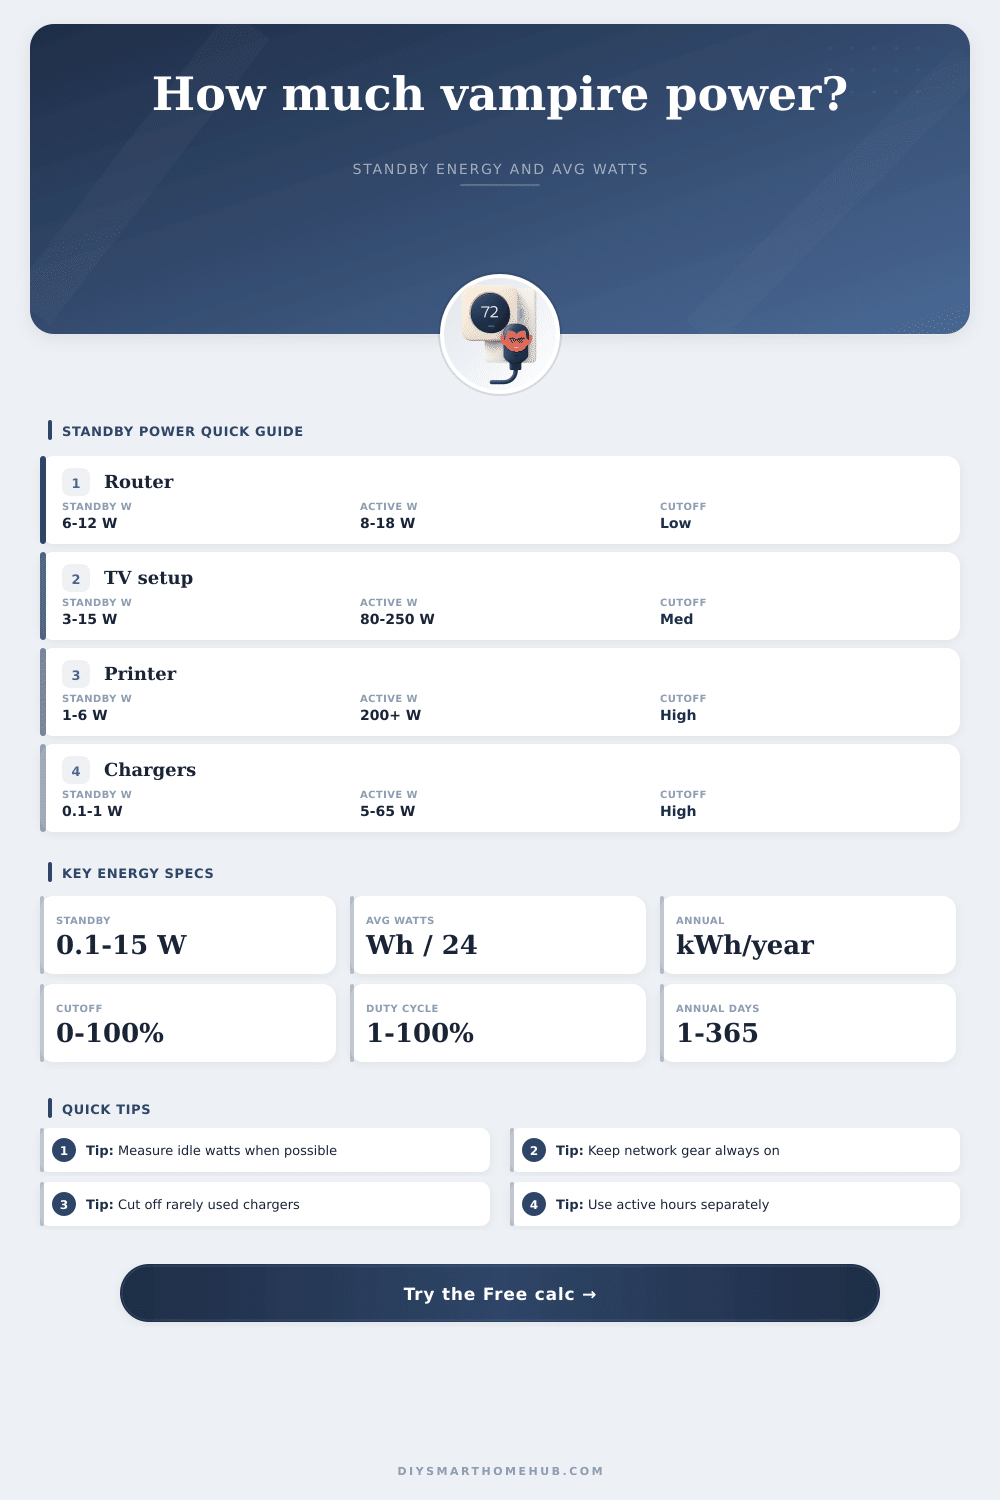
| Device group | Typical standby watts | Typical active watts | Cutoff fit |
|---|---|---|---|
| Network router or modem | 6-12 W | 8-18 W | Usually keep powered unless a planned outage is acceptable. |
| TV, receiver, streaming box | 3-15 W combined | 80-300 W combined | Good candidate when wake timers and recordings are not needed. |
| Inkjet or laser printer | 1-6 W | 200-800 W while printing | Strong candidate if used only on demand. |
| Chargers and adapters | 0.1-1 W each | 5-100 W while charging | Strong candidate for groups that sit idle most of the day. |
| Smart speaker or display | 1-5 W | 3-15 W | Cutoff only when voice control is not expected. |
| Preset | Standby setup | Active setup | Planning note |
|---|
| Cutoff pattern | Typical cutoff | Best match | Watch item |
|---|---|---|---|
| Night schedule | 25-45% | Desks, chargers, audio racks | Devices that need overnight updates or recording. |
| Away schedule | 40-70% | Guest rooms and rarely used displays | Make sure automation does not remove essential devices. |
| Manual scene | 10-35% | TV consoles and hobby benches | Works only when the scene is used consistently. |
| Full switched strip | 70-100% | Chargers, printers, spare monitors | Use only on loads that tolerate complete power removal. |
🔧Vampire Power Tips
When you turn out the lights at bedtime, do you think your house is quiet? No TV. No printer. Your phone charger’s resting on nightstand. Plugged in but not doing anything you can see. In the silence, you might figure there isn’t any electricity being used; everything has been reduced to a big fat 0 on the meter. But guess what?
Your home is never realy asleep. A tiny bit of electricity leaks through every circuit and wall, so all those components is ready to respond to the next command. We call this standby load or vampire power… It doesn’t appear anywhere in your active bill breakdowns, but it accumulate over time, month after month and year after year.
How to Save Energy in Your Home
After you figure out the details of your devices, however, the calculator do all the work, sparing you from having to approximate the conversions and coefficients yourself. There are two types: an “active” mode and an “idle” mode. These aren’t two different modes of a single appliance; it’s just that each piece of equipment use different amounts of power when working versus when idling.
It doesn’t matter if you have two or 200: some appliances is always-on but use very little (like routers, which typically draw only about ten watts), while others are rarely used but hog the power big time (like those vacuum cleaner that suck up a lot of juice for like twenty minutes a month). Basically, knowing what exactly they measure are key.
Where to begin? With the chargers. Because even when not attached to a phone, these little bricks siphon energy, making them infamous energy vampires. Newer versions is efficient, sucking down barely a fraction of a watt. But older versions or cheap, third party adapters will suck up a lot more. When you’ve got five charger plugged in and use them for an hour at most; but leave them on overnight; the standby time is greater than the active time.
The tool has a feature where you can enter exactly that: How many devices? How many watts do they draw while idling? You can also tinker with the cut-off percentage if you’re going to put them on a smart plug (or switched) power strip and turn off the juice at night.
The other metric is active energy which is the amount of work you’re performing. You use a lot of power in big bursts when you charge your phone/laptop, stream movies or print documents. This is where the duty cycle input comes into play, very few devices operate at maximum output during all of their on-time. A printer will heat up for 30 seconds before idling as it spits out some paper. If you don’t take that pulse into account, you’ll assume you’re doing more work then you really are. It’s a small detail, but one that makes the data accurate.
For network gear, however, there’s a different issue: routers and modems requires 24/7 availability. Schedule it off and you’ll lose internet access. It’s listed in the table of references on the page with its stand-by draw constant, but its power cutoff is low. Automating these devices just tends to cause you more pain than gain.
Instead, direct your attention somewhere else, like office equipment that only runs when in use (i.e., idle for days at a time) or an entertainment center. For most homes, smart plugs are a useful tool. For example, use a schedule to turn off power at night, which cuts out all standby power completely. Use the calculator to see what kind of difference it makes.
Take out 60 percent of your standby load. This shows exactly how much energy you save. That lets you understand how worthwhile smart strips or switches really are, seeing the impact of getting rid of even 60 percent of your standby load helps justify the small cost, and now you have data. You’re not saving blindly; you know exactly how much less electricity you consume.
All of this boils down to awareness. You must be aware that there is always a tax for convenience. You don’t have to manually unplug everything each evening, which would of get annoying fast and defeat the purpose. Instead, find your largest offenders, collect them in switched outlets and automate the rest.
Being efficient doesn’t mean having a lifeless home. Your home can remain responsive yet efficient. And, finally, those quiet nights can realy be quiet. No longer just quiet with background hums.